 ">
">
The 2017 Appalachian Trail Thru-Hiker Survey: General Hiker Stats
Each fall, The Trek conducts an in-depth survey of long-distance hikers on the Appalachian Trail (AT), this time surveying the class of 2017. We have several posts to come on the main gear items, but this post covers our data on the timeline of their treks, their favorite sections of the Trail, the sections they found the most difficult, their hiking partners, and their adherence to Leave No Trace practices, their budgets, and participation in hiker festivals and check-ins.
Participants were recruited through social media, particularly Facebook groups for the AT Thru-Hiker class of 2017. Data were collected from October 24, 2017, to November 21, 2017.


Demographics
253 people who hiked on the Appalachian Trail in 2017 took the survey.
Age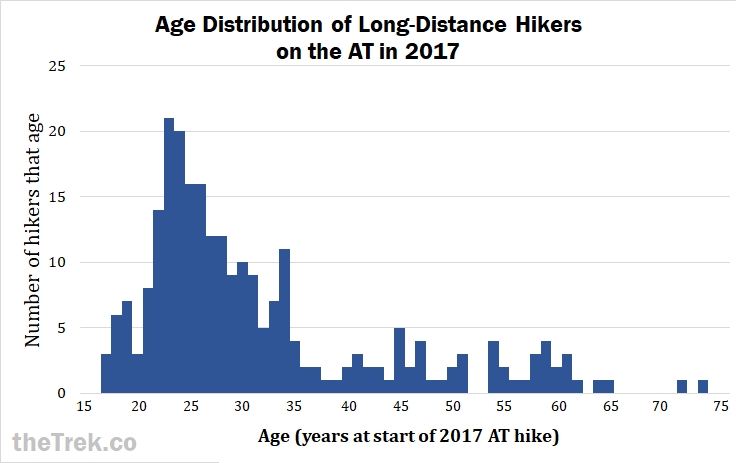
The average (mean) age of hikers in the survey was 32 years old, plus or minus 12 years, with a median age of 28 years old. Hikers ranged in age from 17 to 74.
Gender
Women comprised 46% of hikers in the survey, while about 54% of hikers were men.
Race & Ethnicity
The vast majority (96%, n = 239), of hikers in the survey were White. Three hikers identified as Asian, three as Hispanic/Latino/Latina, three as Native American/Alaska or Hawai’i Native, and one as multiracial/multiethnic.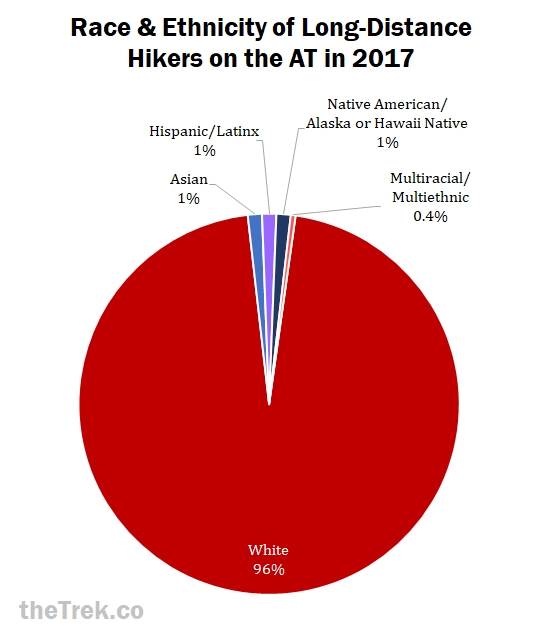
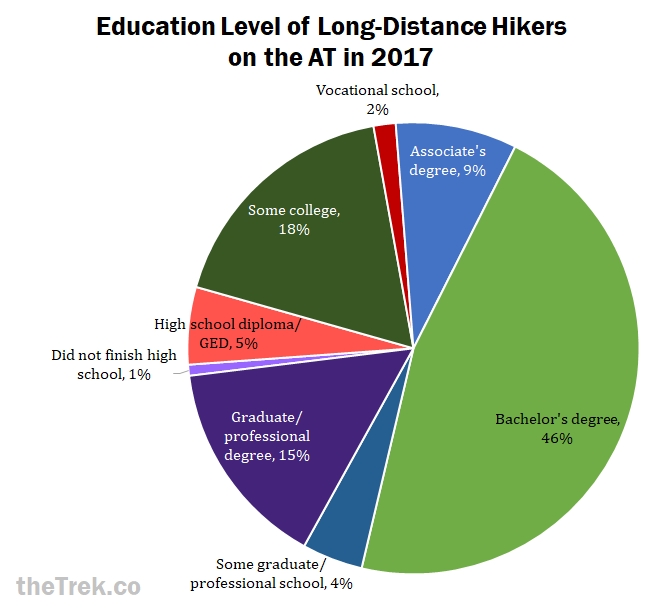
Education
Nearly half of hikers in the survey had bachelors degrees. Note that the one of the two hikers who had not yet finished high school was only 18 years old.
Nationality
Nearly all hikers were from the U.S., with Canadians at a distant second.
State
Hikers were predominantly from the East Coast, particularly from states that the Appalachian Trail passes through.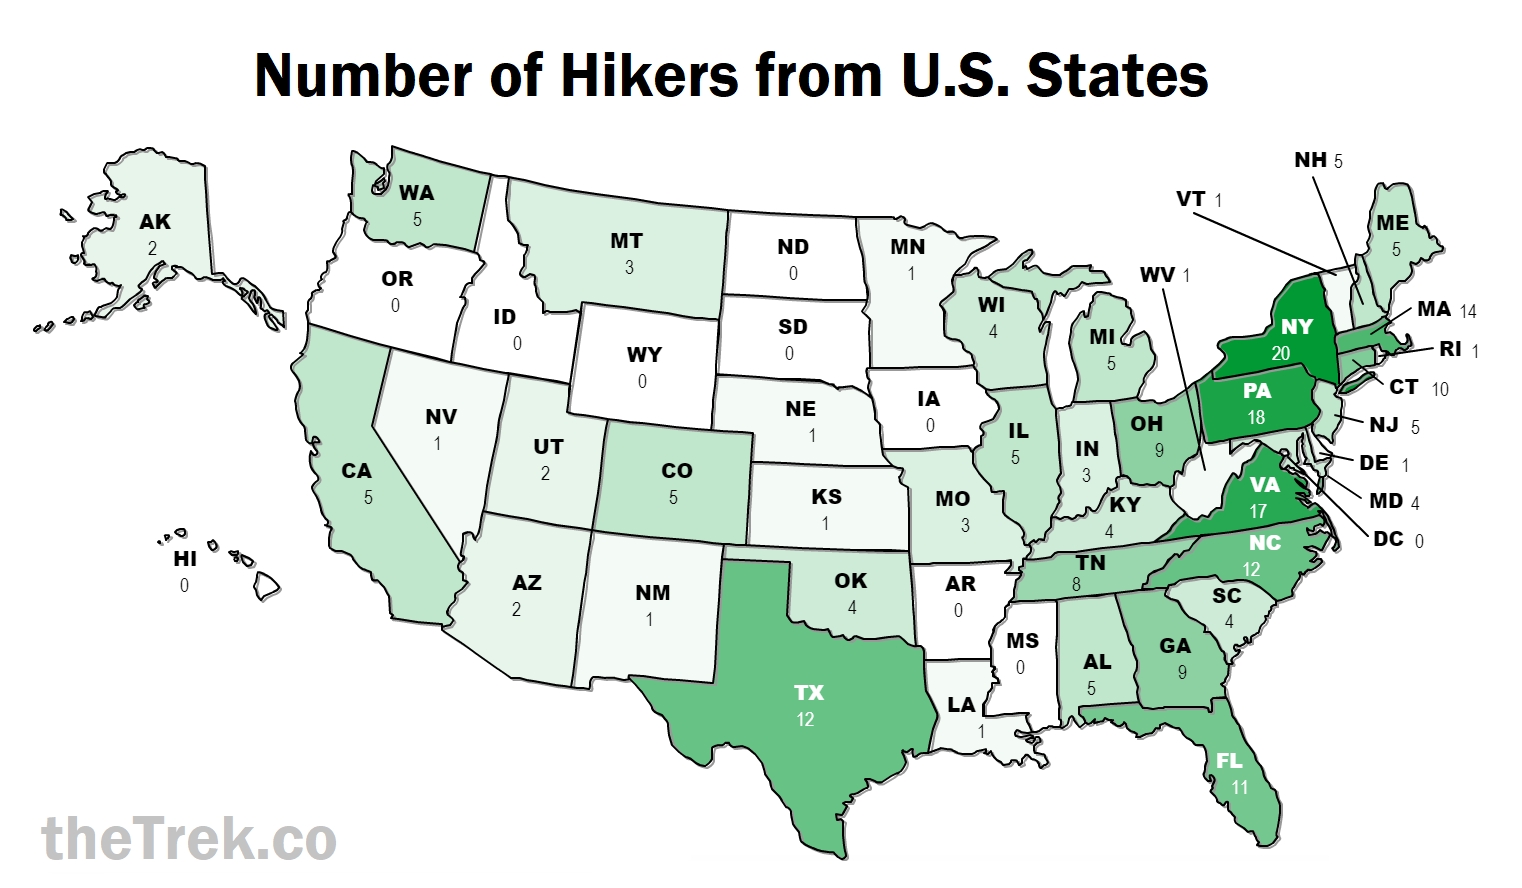
Preparation
Prior Experience

The majority of hikers had gone backpacking between 1 and 7 nights. Very few had no camping or hiking experience, just as very few had done long-distance backpacking.
Budget
We asked hikers in the survey how much the spent on gear for their hike, then how much they spent in total (gear and expenses along the way).
Last year, most hikers had a total budget (all expenses, including gear) of $4000 to $6000. However, this year almost 40 percent of hikers spent over $6000 total on their hikes. Older hikers were better represented in the survey this year, so I checked to see if they were spending more than younger hikers. There was a small, but significant correlation between total budget and hikers’ age, with older hikers spending more (r2 = .197, p = .005, N = 202).
The average amount spent on gear alone was between $1000 and $2000, but anything from $500 to $3000 was fairly common. Age was not correlated with gear budget, meaning hikers spent about the same amount on gear regardless of their age. Considering that the average gear budget remained about the same as last year, I would recommend that between $1000 and $2000 is sufficient for most hikers to purchase the gear they need for a thru-hike, although a substantial portion will need $2000 to $3000.
Last year, we followed up by asking hikers if they found their budget sufficient. Because nearly all hikers answered “yes,” regardless of budget, I did not analyze that data this year.
Resources
We asked hikers which resources they found helpful or inspiring and which ones were not. We also asked them what other resources they used that we hadn’t mentioned.
By far the most helpful (and perhaps inspiring) resource for long-distance hikers on the AT is The A.T. Guide by David “AWOL” Miller. This guidebook includes elevation profiles, maps of trail towns, hostel rates and contact information, locations of water sources, shelters, side trails, and just about every feature of the AT that hikers would want to know about. It also has additional information on access to the southern and northern terminuses. It should be noted that the ATC publishes a similar guidebook that 18 percent of hikers found helpful (10 percent did not like it).
Here are links to resources (where possible), in order of their popularity:
- The A.T. Guide by David “AWOL” Miller
- TheTrek.co
- The GutHooks app on iTunes and on Google Play
- The Appalachian Trail Conservancy website
- Appalachian Trials – the book
- WhiteBlaze.net
- A Walk in the Woods – the book
- TrailJournals.com
- The Appalachian Trail Thru-Hiker’s Companion(The ATC’s guidebook)
- The AT subreddit
Facebook groups, YouTube videos, and Instagram pages were all cited as helpful or inspiring. There are Facebook groups by class of thru-hikers (e.g., “Class of 2017”), a separate one for women, and one for the Appalachian Long Distance Hiking Association. These can be located with a simple search.
The “other books by hikers” were Where’s the Next Shelter by Trek writer Gary Sizer, Wild by Cheryl Strayed, Walk for Sunshine by Jeff Alt, AWOL on the Appalachian Trail by David “AWOL” Miller, Grandma Gatewood’s Walk by Ben Montgomery, and The Barefoot Sisters books (Southbound and Walking Home) by Lucy and Susan Letcher.
The only resources that were more often disliked than liked were A Walk in the Woods (the movie) and workshops for preparing for a thru-hike. Although we don’t have much data for these two, since most hikers said they never tried them, A Walk in the Woods (the movie) and workshops were likewise unpopular with the Class of 2016.
Timeline
Distance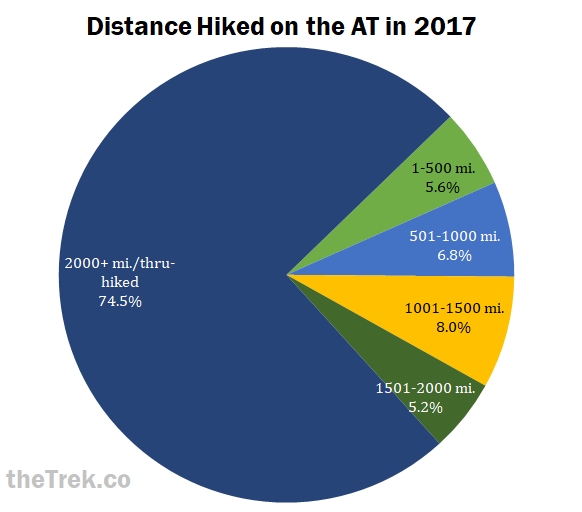
Thru-hikers were the target of this survey, and comprised the majority of hikers who took it.
Section Hiking
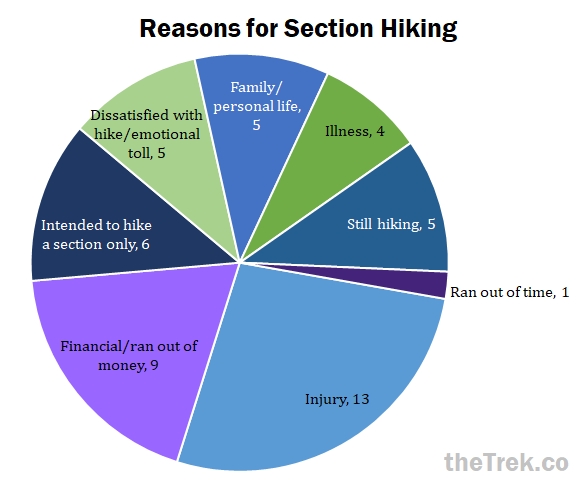
Of the 48 survey participants who did not thru-hike, only 6 had intended a section hike. The other 42 were unable to finish intended thru-hikes. Injuries were the most common reason that hikers quit. Note that five hikers were still on the Trail at the time they responded to the survey. This annual survey doesn’t go into detail about reasons hikers quit, but check out our data from a different survey for more information on illness, injuries, and reasons hikers quit.
Thru-Hike Timeline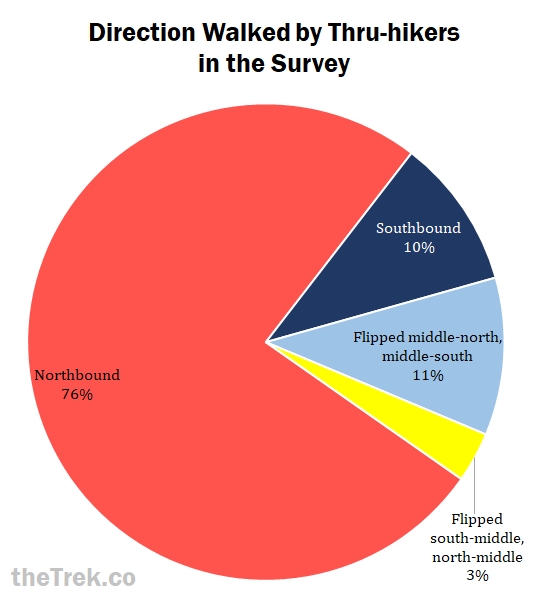
The vast majority of thru-hikers who took the survey walked northbound, which is by far the most common direction for AT thru-hikes. However, we had a higher percentage of southbounders and flip-floppers represented in the survey this year, compared to previous years. This could be due to sending out the survey a few weeks later in the year, but also due to the Appalachian Trail Conservancy’s recent efforts to space out the traffic of thru-hikers on the AT.
The majority of hikers started their hikes between early March and early April (with Friday, March 17 being the most popular date last year), which is considered the “Bubble” for AT thru-hikes. The earliest hiker began February 1, 2017, and the latest start date was September 4, 2017. This was a change from last year’s data, where we saw several hikers begin as early January or even December of the previous year. While there are far fewer southbound and flip-flop attempts each year, mid-June appears to be the “bubble” for southbound thru-hikes.
The most common finish dates for northbound thru-hikers were throughout the month of September, and early October. Most southbounders finished in November, or were still hiking when they took the survey.
Pace
For thru-hikers, the average and median pace they walked was 16 miles per day, with two thirds of thru-hikers maintaining an average pace between 12.5 and 19.5 miles per day.
In contrast, the pace was several miles per day slower for section hikers and people who attempted, but did not complete, thru-hikes. The average pace for section hikes and incomplete thru-hikes was 13 miles per day (median 12 miles), with two thirds of ranging from 9.5 to 16.5 miles per day.
Sections of the Appalachian Trail
We asked hikers to rate sections of the Trail for both how much they liked them and how difficult they were. Hikers could rate more than one section as “favorite,” “least favorite,” “most difficult,” and “easiest.” The percentages shown below exclude hikers who said they did not hike that section.
Favorite and Least Favorite Sections
 The section most commonly picked as a favorite was the Baxter State Park, home of the AT’s northern terminus, Mt Katahdin. The White Mountain National Forest was a close second. The Mt Rogers/Roane Highlands area, where wild ponies roam, had topped the charts last year as the section most frequently ranked a favorite. This year, it was the third most popular, followed by the 100-Mile Wilderness, southern Maine, , the Roanoke region (which includes well-known McAfee Knob and Dragons’ Tooth peaks), Vermont, and the Great Smoky Mountains National Park.
Northern Pennsylvania, known in the hiker community as “Rocksylvania” for its rocky terrain, was by far the least liked section. The New York/Connecticut section was the second most commonly ranked as a least favorite section.
Easiest and Most Difficult Sections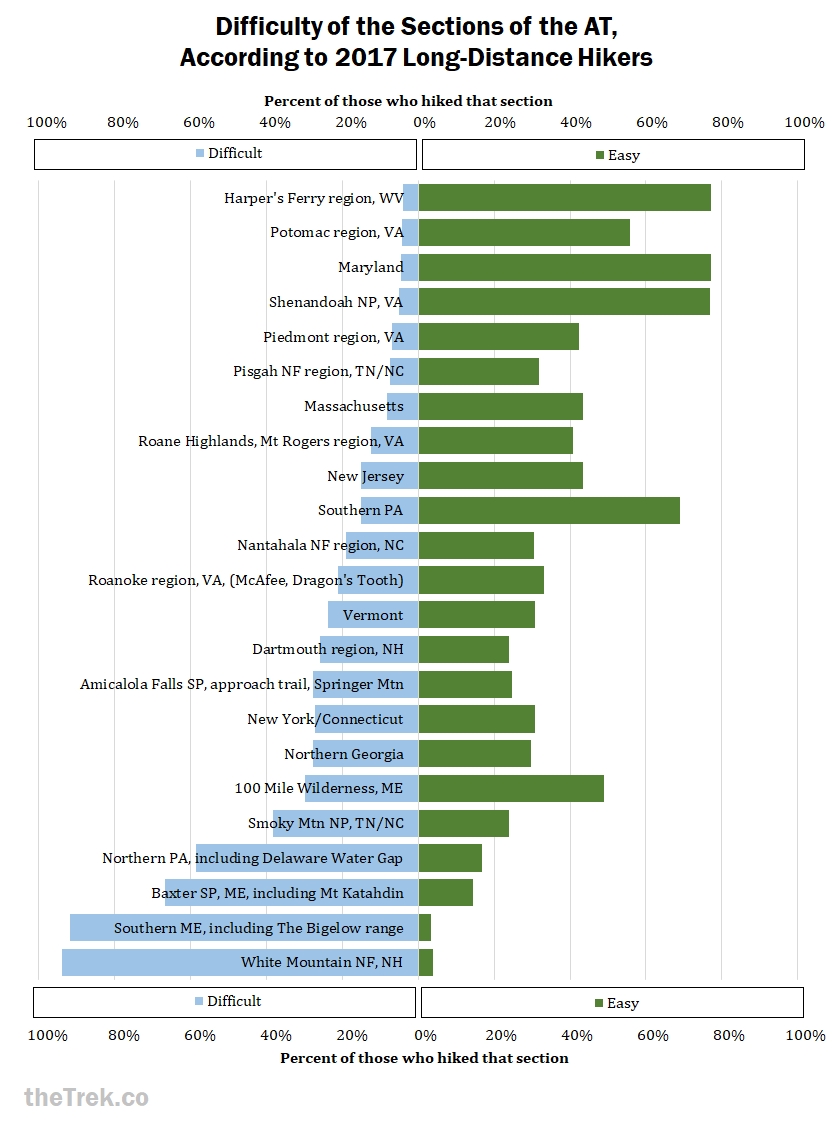
Northern Pennsylvania was not only the least favorite section of the AT, but it was also often rated a most difficult section. However, the other most difficult sections of the Appalachian Trail were also among the favorites: The White Mountain National Forest, southern Maine, and Baxter State Park/Mt Katahdin.
Three sections were equally rated the easiest, by 77 percent of hikers in the survey: the Harpers Ferry area, Shenandoah National Park, and Maryland. Shenandoah National Park was also rated the easiest last year; through the park, the AT has many road crossings with the Blue Ridge Parkway, so it is easy to “slack pack” this section, access amenities like blackberry ice cream, and sneak in some road walking instead of sticking to the trail. Just north of Harpers Ferry, West Virginia is a flat walk alongside a canal (I recall this being the flattest section of the AT). The historic town of Harpers Ferry is also home of the Appalachian Trail Conservancy headquarters. The trail through Maryland is not as distinct of a section, but it consists of hills and farmland, without any particularly high peaks. Furthermore, because Harpers Ferry and Maryland are towards the middle of the trail, both northbound and southbound hikers will usually hit these areas during warmer, mild seasons, which might make them seem even easier.
Partners
The majority of thru-hikers who took the survey set out alone, but most ended up hiking the majority of their trek with friends made on the trail. Last year, only one thru-hiker in the survey hiked with a dog for the majority of the trek, and one hiker’s dog did not complete the majority of the hike. In contrast, this year four thru-hikers set out with their dogs and all four remained for the majority of the hike. Two hikers said they did not start with a dog, but finished with one. It is unclear whether these two joined up with hikers who had brought dogs from the beginning, or whether their dogs joined them later in the hike. Either way, hikes with dogs appeared to be more successful this year!
Similarly, about 12 percent of participants who completed a thru-hike set out with a significant other, and about the same number walked most of the way with a significant other. Two people who started out with a significant other finished their hikes solo. Four people who started out solo or just with friends ended up hiking the majority of the way with a significant other.
Leave-No-Trace practices
About 95 percent of hikers reported they packed out all of their own trash. About half of these hikers sometimes packet out other litter on the trail. Seven percent of hikers in the survey packed out all the litter they encountered!
A few hikers (2.8%) either packed out or burned their trash. Burning trash is a controversial practice which I have sometimes seen recommended by trail clubs and park maintenance, but it is typically not considered best practice for outdoor ethics. Six hikers in our survey admitted to leaving trash behind intentionally; two did so to shed weight and four did so as “trail magic.” This may seem like a small number of hikers, but considering the time they spent in the woods and the distance they traversed, this could have had a huge impact on the wildlife and conservation of the Appalachian Trail corridor. If you are one of the well-meaning hikers who leaves trail magic unattended, especially if you hike on without returning to clean up the mess, please know that this is NOT a good deed. You are creating a hazard for local wildlife, who should be prioritized above providing assistance to humans in the area.
Festivals and Check-Ins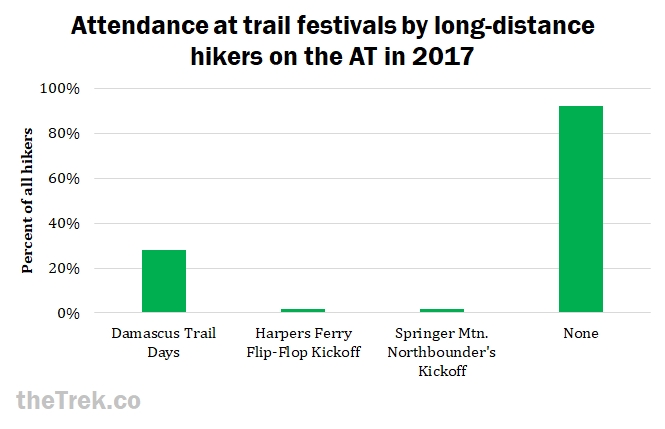
Over a fourth of hikers in our survey attended Trail Days in Damascus, VA, but very few attended the kick-offs at Harpers Ferry or Spring Mountain. Most did not attend any of these festivals.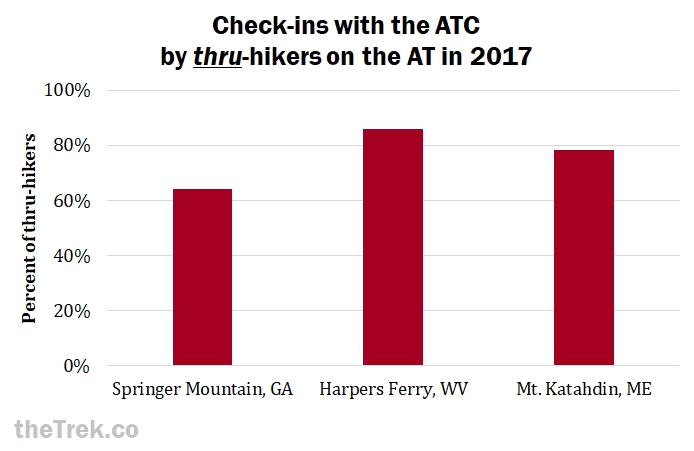
Regarding thru-hikers only, about 6 in 10 checked in at Springer Mountain, 9 in 10 checked in at Harpers Ferry, and about 8 in 10 checked in at Mount Katahdin. This was about the same as last year. Checking in with the ATC helps them research surges in numbers of hikers and to prepare for future maintenance of the trail. There are two ways to access Springer Mountain: the Approach Trail and a forest service road that intersects the AT about 1 mile north of Springer Mountain. Hikers who skip the Southern Terminus Approach Trail and park at the forest service road a mile from Springer Mountain won’t pass the Amicalola Falls State Park facilities and will be unable to check-in. This may be one reason fewer hikers are checking in at Springer Mountain. Another reason is that most hikers are walking northbound, so they may be unaware of the check-in system when they set out, but they may know to check in by the time they reach Harpers Ferry and Mount Katahdin. (This was the case for me and I’m still bummed I didn’t figure out my starting number).
More from the 2017 Hiker Survey
This is the first post on our survey of the hikers of 2017. Upcoming posts will cover our survey data on backpacks, footwear, shelter systems, sleeping bags, stoves, food, and water, and sleeping pads. Subscribe to The Trek Newsletter to ensure you don’t miss the forthcoming survey results!
Muchas Gracias
CONGRATULATIONS and many thanks to all the hikers who took the survey! Best of luck to those who are still on the Trail. Thanks also to Zach Davis and Maggie Slepian for coordinating and for spreading the word about the survey.

This website contains affiliate links, which means The Trek may receive a percentage of any product or service you purchase using the links in the articles or advertisements. The buyer pays the same price as they would otherwise, and your purchase helps to support The Trek's ongoing goal to serve you quality backpacking advice and information. Thanks for your support!
To learn more, please visit the About This Site page.

Comments 21
Good info. Most confermed what I’ve already suspected. It’s suprised at the high amount spent on gear. Im curious if there was any reported crime throughout the trail? I have heard of theft of gear and simple assaults in the past.
I am planing a 2018 through hike.
Thanks! well-presented and helpful info, great job!
I thru-hiked in ’13-’14. I’m now studying data journalism at UF. What program did you use for these beautiful charts? They’re amazing.
Thank you! I just made them in Excel.
Mariposa, This is really cool! I’m taking a stats course for my MBA and one of the projects involves identifying a research question and then learning how to analyze raw data. Would you be willing to share any or all of the raw data from the survey? I think this would make a neat subject for my class project.
A good read, with many questions answered. Thanks
Nice overview!
This is part of the deal, would also be very interested in experiential, social or transformational (and spiritual) aspects of ‘doing the trail’. What happened afterwarts.
Nice work Mariposa! Any thoughts on doing a year to year comparison on this data? Also note that “ATC’s Guidebook”, The Thruhiker’s Companion, is researched and published by ALDHA volunteers, it is not created by ATC staff.
Cosmo
Thanks! I would like to do some year-to-year comparisons but I haven’t had the time. I may also compile the SOBO data across several years so we can get some better data on that segment of the sample. In the future it would be nice to do that for flip-floppers too but I don’t think we have enough data on them yet.
Well done and so very insightful! I will leave Springer on February 1, 2018 (T346) at age 66! Retired and will meet spouse in Damascus to hike Virginia with me. Thank you for your work and look forward to more to come!
Well organized and interpreted study. I would have been happy to be a respondent this past year and am willing to next. I’m writing a book on off trail fun stuff to do, (Yellow Blaze Guide to the Appalachian Trail ) mostly for section hikers or hiker supporters who will pass through towns 25 miles either side of the trail and seek fun events, venues and music en-route. I’m a NB section hiker @ Harpers Ferry NB and returning in June to finish.
Great info! How about some on footwear, foot care etc?
wow. what a great survey!! amazing read. thanks alot
Wonderful resource, thanks! I got here searching for detailed stats on total days for successful thru-hikers. Beyond average pace, could you folks also include this graphical data as well?