 ">
">
The 2021 AT Thru-Hiker Survey: General Information
Welcome to the 2021 Appalachian trail thru-hiker survey! We are glad to be back after taking last year off due to… well you know. (We did survey AT section hikers last year for the first time ever, though—so be sure to check that out next!) We had 310 responses to the survey this year—a huge thank you from us and your future hiking buddies.
This is the first post in the series, each of which will focus on a specific theme. We’ll start out with the basics.
A Few Notes on the Data
Data was collected from participants recruited via our social media platforms, Backpacker Radio, and TheTrek.co. Participants submitted surveys anonymously between October and November of 2021. There was some data cleanup done during the analysis of the data, but this was only where necessary (like that one participant who insisted Texas was a country). We also changed any start dates that referenced 2022 to 2021 and couldn’t find any obvious duplicates in the data. That said, please keep in mind you can’t always believe the answers to what you ask strangers on the internet.
The survey asked the majority of the same questions as in prior years focusing on hiker demographics, LNT, gear, and resources. This year we added the following subjects:
- How COVID impacted people’s perception of the hiking experience
- Vaccination status
- How often hikers hiked or slept alone
- Favorite parts of the trail
- Resupply/town strategy
Right, let’s get started!
Demographics
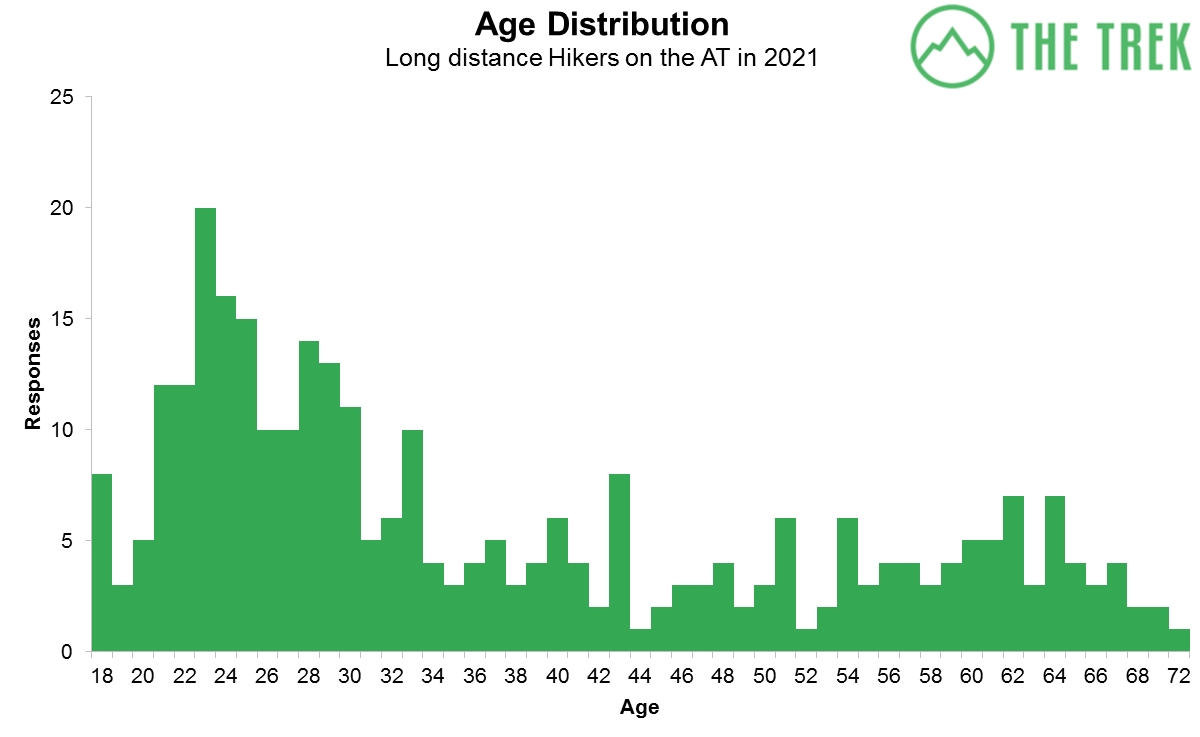
We had 310 responses to the survey this year. The average age of hikers in the survey year is 37.2, up slightly from the 36 year-old-average found in our 2019 survey.
However, it’s important to note that this average is skewed by a wide range of more mature hikers. Over 50% of respondents were under the age of 31. The most common age was 23 with 20 respondents. This is possibly because many people thru-hike after graduating college and before entering the workforce.
This year our youngest respondent was 18, while our oldest was 72 – although in reality, the oldest person to hike this year was 83-year-old Nimblewill Nomad and the youngest was five-year-old Harvey Sutton. Listen to our interview with Nimblewill Nomad here.
Sixty-two percent of those surveyed were biologically male, while 38% were biologically female. 1% of respondents identified as non-binary or other.

Two hundred eighty-three respondents (92%) identified as White, 14 as multiracial, seven as Black, two as Hispanic, and one as Asian. These statistics suggest that the AT thru-hiking community is still overwhelmingly White, although diversity is up slightly from 2019 when 95% of survey participants were White and there were no Black participants.

Two-thirds of those who hiked had a Bachelor’s degree, Associate’s degree, or professional degree. In terms of this statistic, it’s also important to note that 40 of the respondents (13%) were under the age of 21, by which age attaining a bachelor’s degree would have been unlikely.
Even more so than normal, most hikers were from the United States. Only three respondents were from outside of the USA—two from Canada and one from Argentina. This is primarily due to international travel being severely restricted in 2021 because of the pandemic.
As in previous years, the majority of hikers come from the east coast, concentrated more so this year than in previous surveys—again, possibly due to the pandemic restricting or discouraging long-distance travel. Virginia, Florida, and New York saw the highest number of respondents, all notching up more than 20 responses apiece. Also, to the two hikers from Washington D.C.: unfortunately, you don't feature on the map above, because D.C. is not a state (shrugs apologetically).
The Hiking Basics
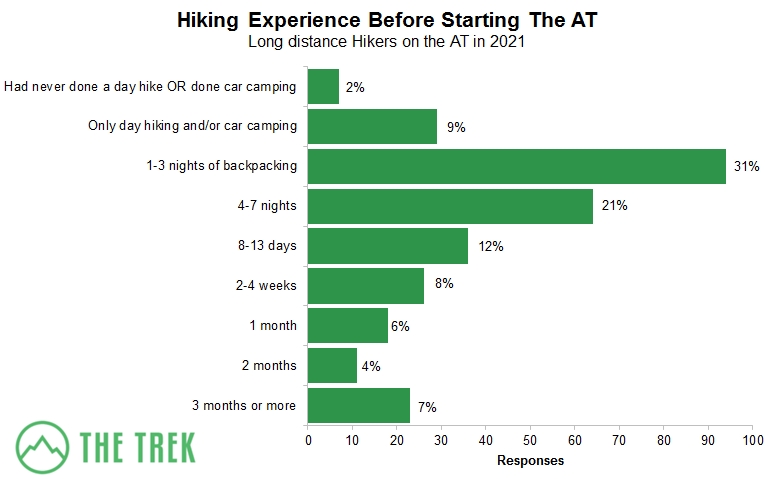
Nearly two-thirds of survey participants said the longest trip they’d done prior to starting the AT was seven days or fewer. Even more remarkably, 11% had no prior overnight camping experience, of whom 75% still managed to hike the entire trail.
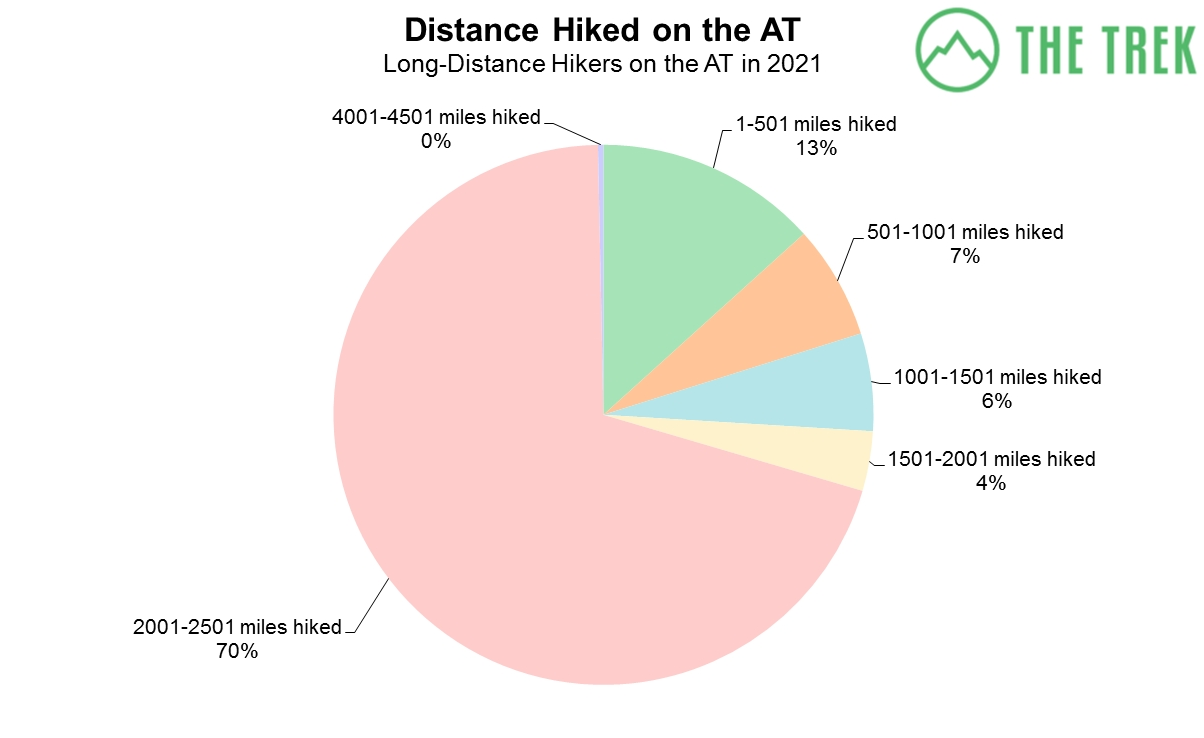
Our target population for the survey was thru-hikers, and they comprised the majority of respondents. Seventy percent of respondents (n = 216) hiked the entire trail successfully, with one respondent yo-yoing (thru-hiking both northbound and southbound in one hiking season).
These numbers are in sharp counterpoint to data presented by the Appalachian Trail Conservancy (ATC), which reports completion rates between 20 and 25% most years. The disparity might be explained by the fact that the ATC is working with a larger dataset. Also, participants in a survey given out by The Trek, a website devoted to thru-hiking, might be more ingrained in the hiking community to begin with, skewing success rates higher than the general population.
READ NEXT - Why 75% of AT Thru-Hikers Won't Make It (Spoiler: It's Complicated)
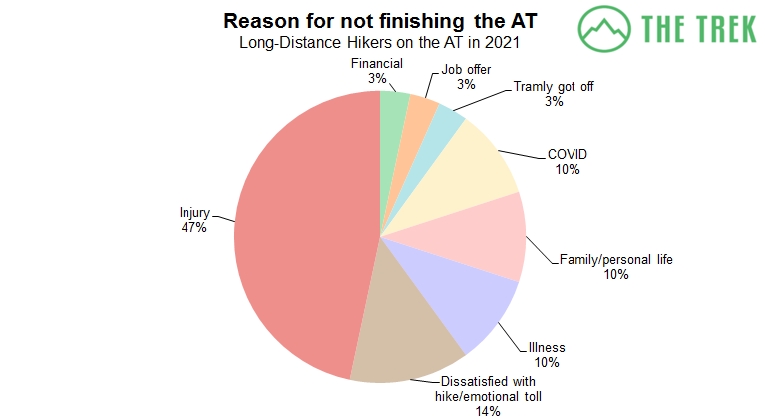
Of the 61 people who did not complete their thru-hikes, 31 only went out with the intention of hiking a section. The other 30 were unable to finish their intended thru-hikes for a variety of reasons.
Injury was the most common reason why hikers quit (cited by almost half of unsuccessful thru-hikers). Four hikers left because they were dissatisfied with their hike/it was taking an emotional toll.
COVID-19

This year we asked respondents a few questions about COVID-19. Four out of five respondents said they were fully vaccinated, while a further 4% had been partially vaccinated. 14% were unvaccinated.

When asked about their concern for COVID prior to departing 57% ranked their concern as a 1 or 2 (i.e. not concerned/slightly concerned). Six percent were very concerned before heading out.
About half the respondents said that the perceived risk of COVID on trail was about what they expected, while 40% stated that the perceived risk was less than they expected.
Timeline

The vast majority of thru-hikers that took the survey walked northbound. Since last year, the percentage of respondents that flip-flopped starting in the middle of the trail increased substantially from 7 to 11 percent.
Interestingly, the majority of participants that flip-flopped came from states on the AT. One possible explanation for this phenomenon is that it's logistically easier for residents of AT states to start from near their homes rather than traveling to one of the termini.

The majority of northbound hikers started hiking from early March to mid-April. This year, the 4th of April was the most popular day. The bubble for flip-flops was from April to May, while June saw the majority of southbound starts.
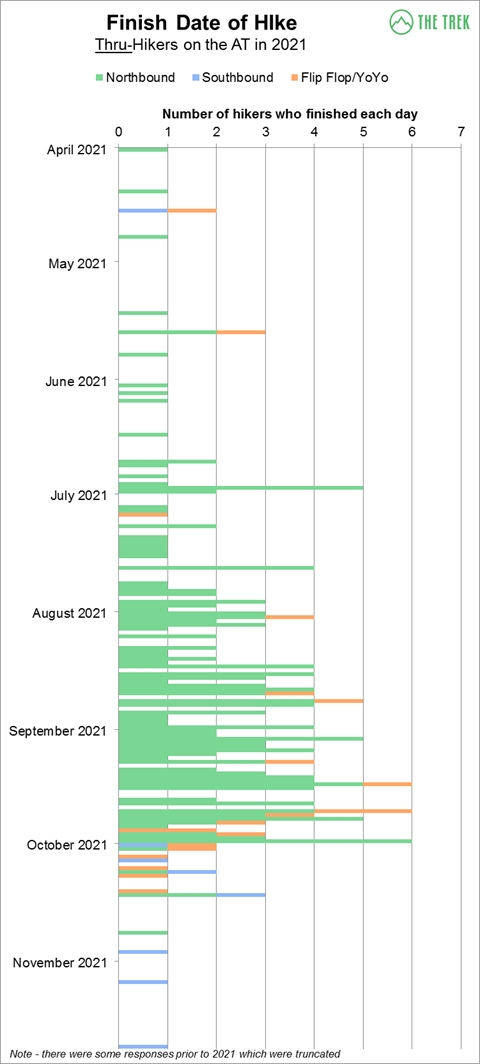
Northbound and flip-flop hikers tended to finish between the middle of September into early October. Flip-floppers tended to finish middle to late October, while there were still a few southbounders on the trail when we collated the results of the survey.
Pace
The average pace for thru-hikers was 13.79 miles per day (calculated by start and end date). The slowest pace was 6.83 miles per day, taking 321 days to complete, though from the comments it looks like they had a bit of time off in between. The fastest hiker averaged 28.1 miles per day finishing the trail in 78 days, starting on the 27th of June and finishing by the 13th of October. The average pace for section hikers was lower at 10.81 miles per day.
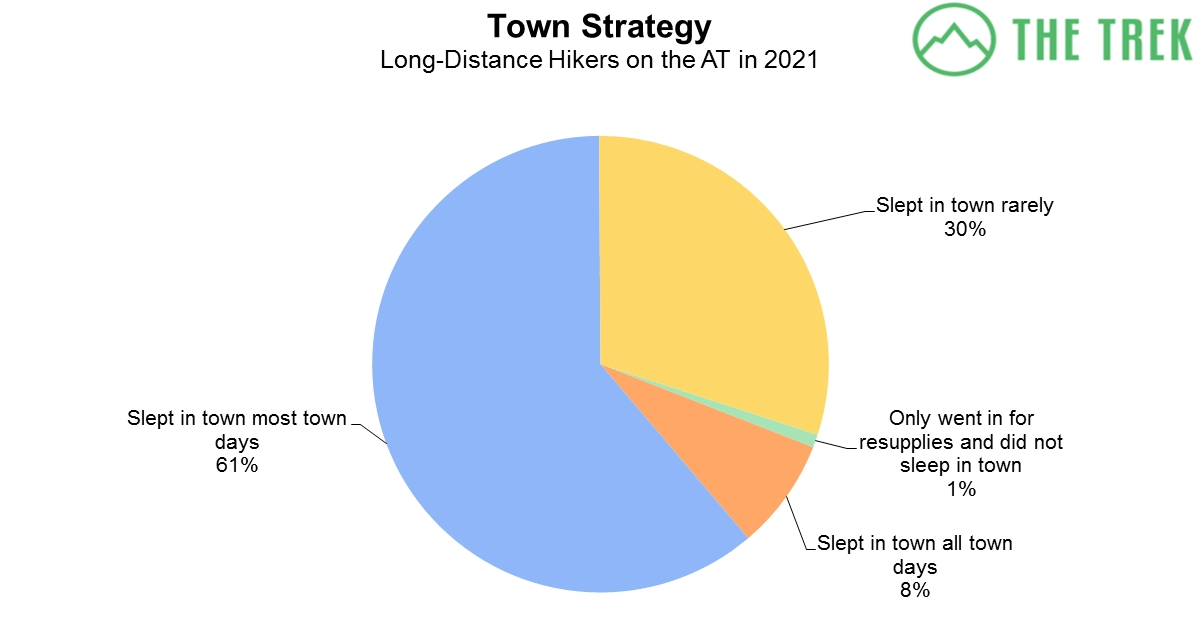
We asked thru-hikers what their ‘town strategy’ was for the AT. Sixty-one percent stated they slept in town on most town days, while 31% either did not or rarely slept in town. Eight percent stated they slept in town on all town days.
Note: the start and end date data for section hikers was a bit all over the place. One respondent filled in the survey for the 48 miles they hiked in total over a single day, while others averaged paces which would indicate less than an hour walking a day. We also removed two respondents from the average thru-hiker pace as they started hiking the trail in 2001 and 2011 respectively, completing it in 2021.
Festivals and Check-Ins

There were noticeably less people checking in or attending Trail Days than in previous years, likely due to the influence of the pandemic. 65% of hikers checked in at Harpers Ferry, and 55% checked in at Mt. Katahdin and Springer Mountain. 40% of those on trail attended Damascus Trail Days, while 2% attended Springer Mountain’s northbound kickoff.
Companionship

Two-thirds of hikers who completed the survey started solo. The other third hiked with relatives, friends, or a significant other. In line with other years, 50% of those who hiked with a dog didn’t make it through their full thru-hike, with one participant specifically stating that their dog's injury got them off-trail.

This year we asked hikers this year what percentage of the time they slept alone (i.e. not pitched with other people or in a shelter with others). The majority slept near other people more than 75% of the time. That being said, the majority of hikers chose not to sleep in a shelter, with 60% of respondents saying they slept in a shelter less than a quarter of their nights on trail.

We also asked hikers how many nights they struggled to find room at a campsite or shelter. Around 70% of respondents reported less than five nights on trail when they struggled to find space to camp.

We also asked hikers what the highest number of people they saw at a shelter or campsite. From the graph above, you can see that the answers varied wildly, with the most common response being 30.

While many hikers chose to camp with others, there was a real mix of how often hikers walked together. This number is slightly inflated by those hiking with friends, significant others, or relatives but indicates that a lot of hikers enjoy hiking by themselves in the day and camping with others in the evening.
Littering Practices
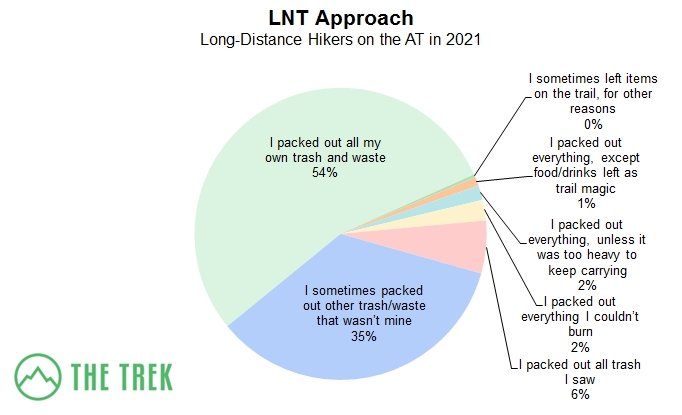
The majority of hikers in the survey reported packing out all their own trash. Just over a third occasionally packed out other trash that wasn't theirs, while 6% packed out any trash they saw.
READ NEXT - Common Leave No Trace Mistakes Made By Thru Hikers, and How To Avoid Them
Resources
We asked hikers which resources they found helpful or inspiring and which ones were not. We also asked them what other resources they used that we hadn’t mentioned.

The most helpful resources were Guthook/FarOut and TheTrek.co (thanks folks <3). This was followed by AWOL's AT Guide and Youtube. The least popular resources were A Walk in the Woods (the movie and the book by Bill Bryson) and Facebook.
Hikers mentioned that other hikers and friends were some of the best resources. Other resources mentioned were the Barefoot Sisters Walking Home, Thru Hiking Will Break Your Heart, The Unlikely Thru-Hiker, and Grandma Gatewood's Walk.
Here are links to the most popular resources:
- The Guthook app, now rebranded as FarOut
- TheTrek.co
- The A.T. Guide by David “AWOL” Miller
- Appalachian Trials – Book by The Trek’s founder, Zach Davis/Badger
- Backpacker Radio Podcast series
- The Appalachian Trail Thru-Hiker’s Companion – published by the Appalachian Trail Conservancy
- ALDHA.org
Facebook: There are Facebook groups by class of thru-hikers (e.g., “Class of 2021”), a separate one for women, and one for the Appalachian Long Distance Hiking Association. These can be located with a simple search.
Instagram: It isn’t clear which pages hikers followed but a good place to start is by following the AT hashtags. Here on The Trek, we regularly feature the best posts of the week during the hiking season.
Reddit: There are subreddits for the AT and for ultralight hiking, among others that might be helpful.
Budget
For the final section of this post, we asked hikers about how much they spend on gear and overall for their thru-hikes. What we can glean from the responses is that living in the woods is expensive!

Half of those that thru-hiked the trail spent between $5,000-$8,000 on their hike. About a third of respondents spent more than this, with nine respondents saying their total hike cost north of $15,000! The majority of these respondents slept in town on most town days.

About two-thirds of thru-hikers spent between $1,000-$2,000 on gear. This equated to about a quarter of the average overall cost of a thru-hike. About a quarter of thru-hikers spent more than this. It is also important to remember that there is the initial cost of purchasing gear for the hike, along with the ongoing costs of replacing shoes, clothing, patching gear or possibly replacing the odd frozen water filter.
Conclusion
This is the first post based on our 2021 thru-hiker survey. Upcoming posts will focus on the best and worst parts of the trail, backpacks, footwear, shelter systems, sleeping bags, and cooking/food. If you have any comments, suggestions, or feedback, please leave them in the comments below.
You can stay abreast of the AT thru-hiker survey articles as they come out by subscribing to our newsletter.
A huge congratulations to all those who hiked the trail this year - Thank you again to all of you who took the time to fill out the annual AT thru-hiker survey.
Featured image: Graphic design by Chris Helm (@chris.helm).
This website contains affiliate links, which means The Trek may receive a percentage of any product or service you purchase using the links in the articles or advertisements. The buyer pays the same price as they would otherwise, and your purchase helps to support The Trek's ongoing goal to serve you quality backpacking advice and information. Thanks for your support!
To learn more, please visit the About This Site page.

Comments 22
Thank you.
So Mariposa has retired from handling this data.
Wish you well.
It would have been nice if you had waited for more SOBOs to finish their hikes before ending the survey. I finished December 9th, and there were at least seven thru hikers who finished at Springer on that day alone.
Hi Pete,
Understand the frustration. We try and throw this right into the middle of the hiking off-season and to get all the posts finished by the end of February, with a post coming out every two weeks. This gives people enough time to prepare.
We kept the survey open till the end of november this year which is a little later than usual but I’ll see if for next year we can collect up until the second week of December to give Sobos a better chance to finish.
Hope you had a good thru.
Joal
Hey there,
I love the hiker surveys and the intel they provide! One thing however – the section about gender, I think it would be much better to phrase it as „X% identified as male/female/other“ and ask for what gender people identify as. Using the term „biologically female/male“ is weird – I wonder if that is a mistake that came from writing up data. It implies that trans people would have to be forced to tick a box for their assigned gender at birth instead of how they identify/live/present and this seems wrong to me. I‘ve not participated in a survey yet, but I plan to this year – and I would love to find out that this is just a phrasing error, and not a question where people are asked for sex over gender (which of course do not match for quite some people).
I hope it is clear what I mean, thanks again for your work!
Your survey(s) are pertinent to me to provide information to hikers on the AT. I served as a ridge runner on the AT in CT and part of MA last summer, employed by Appalachian Mtn Club.
Sometimes lots of questions on trail, for which this information makes me better able to provide facts; thank you.
I am surprised to read the average hikers’ age is approximately 37. I thought much younger.
Are there going to be hostel rankings listed. We all work hard for these.
hi ! this is great stuff. is the data set available for download for those of us who wanna play around with it ourselves ? I’m a statistician. 🙂
thanks so much !
shira