
 ">


The 2025 Appalachian Trail Thru-Hiker Survey: General Information (Part 1)
Each year, The Trek asks all Appalachian Trail hikers to complete a survey about their hike preparation, trail experiences, and personal backpacking journeys. We’ve taken all the information from our 279 responses this year and have prepared a series of graphs to help you better understand the Appalachian Trail Class of 2025.
Our hope is that this survey serves as a great resource for prospective Appalachian Trail thru-hikers as they plan and prepare for their hike. However, please keep in mind that no two hikes look the same, and you should by no means feel obligated to follow the trends or “averages” presented here. Use this data as a guide to inform your decisions, but remember that the most successful hike is the one that works best for you.
This first post will focus on the broader demographics and logistics for Appalachian Trail hikers, while the next post will dig into the on-trail experiences and favorites/least favorites of this year’s Class.
Want to be notified when the 2026 AT Thru-Hiker Survey goes live? Sign up here.
Let’s dive in!
Demographics of Appalachian Trail Hikers
Age Distribution: How Old Are Most Appalachian Trail Thru-Hikers?
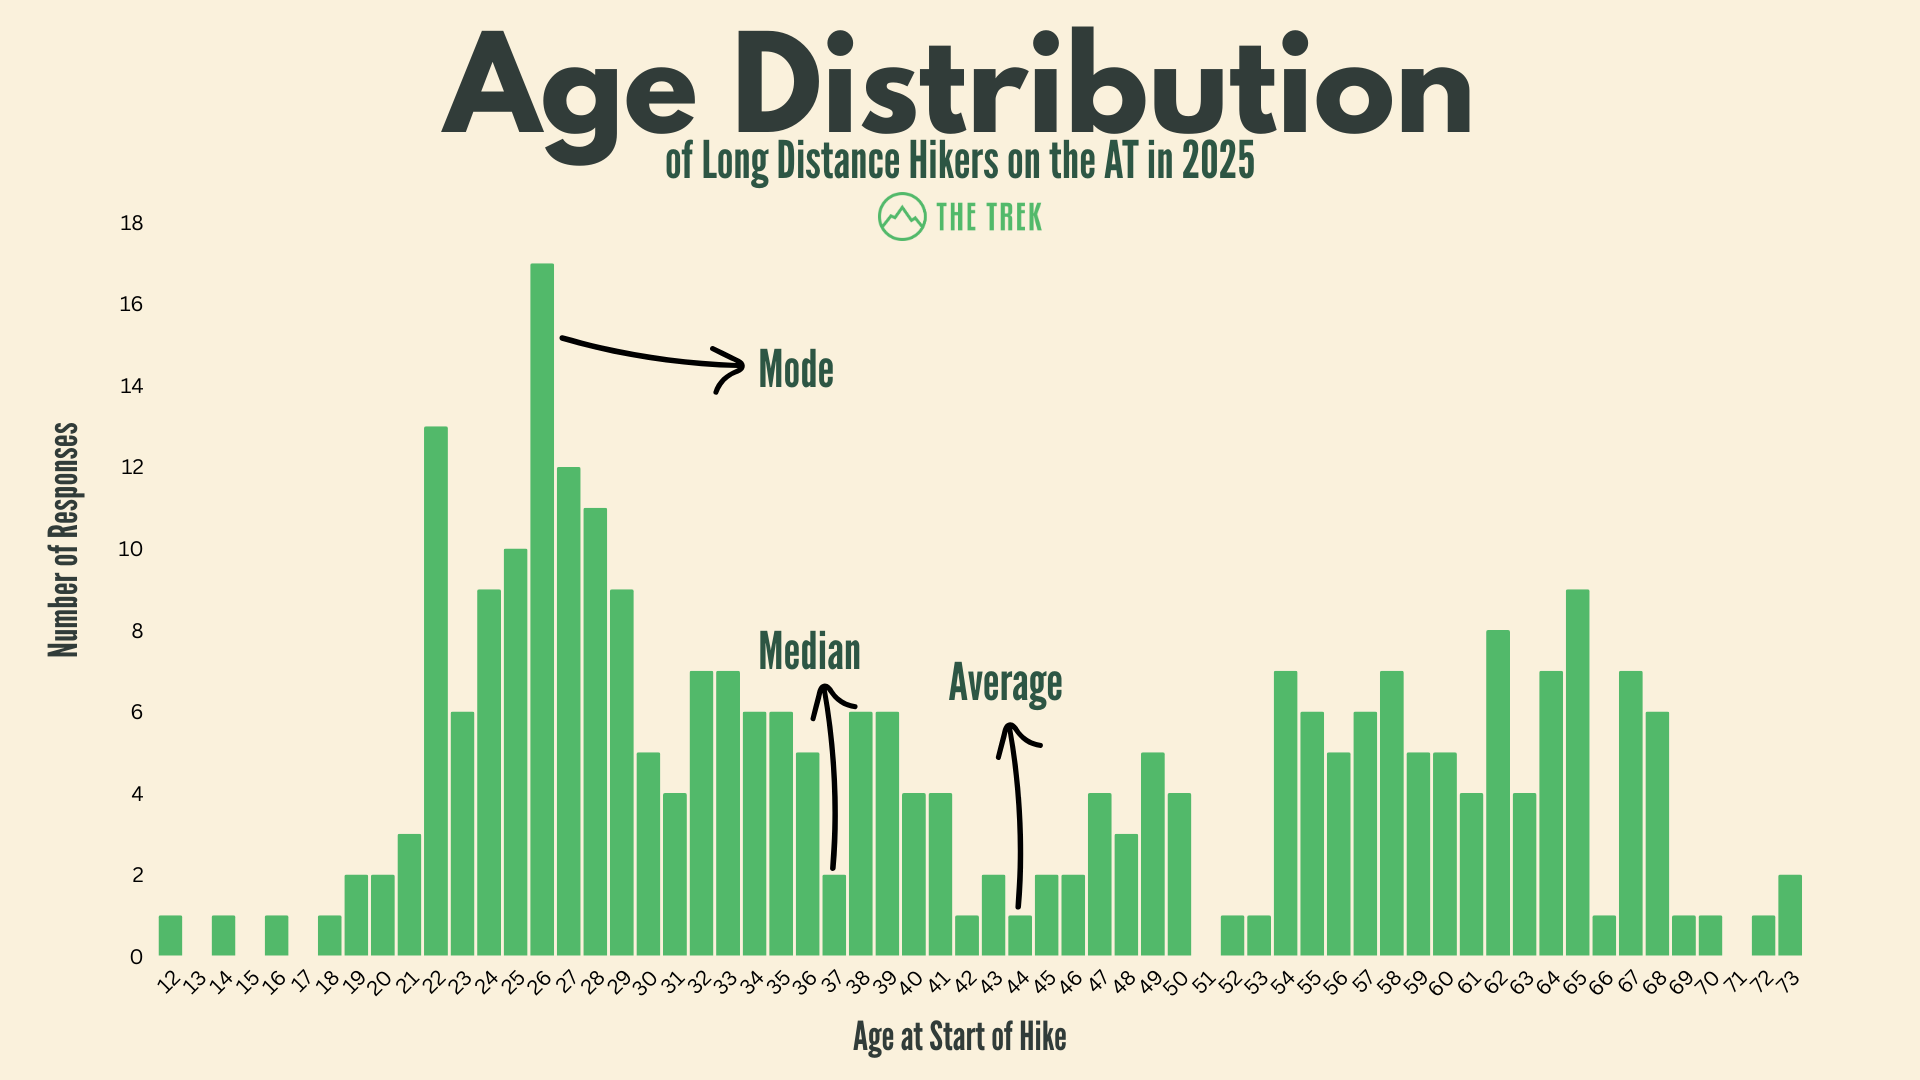
The age distribution of hikers starting the trail remains pretty consistent year over year, although the total spread of ages was somewhat larger this year than in 2024. In 2025, our youngest hiker was 12 years old, while at the other end of the spectrum, two hikers were 73. (Last year, the age range was from 18 to 71 years old.)
We see a large group in their 20s and early 30s, likely represented by recent college graduates and those with fewer ties to their home, such as a mortgage or children. This is followed by another spike of hikers in their late 50s and early 60s, as retirees often have the time and finances to make a thru-hike feasible.
This year, the average age was 44, which is significantly higher than the most common age (26). In statistics, when the mean (44) is much higher than the median (37) and mode (26), it indicates that there is a long “tail” of older hikers. The smaller but dedicated group of older hikers pulls this average up.
READ NEXT: The Appalachian Trail Thru-Hiker Survey: All Years
Gender Distribution
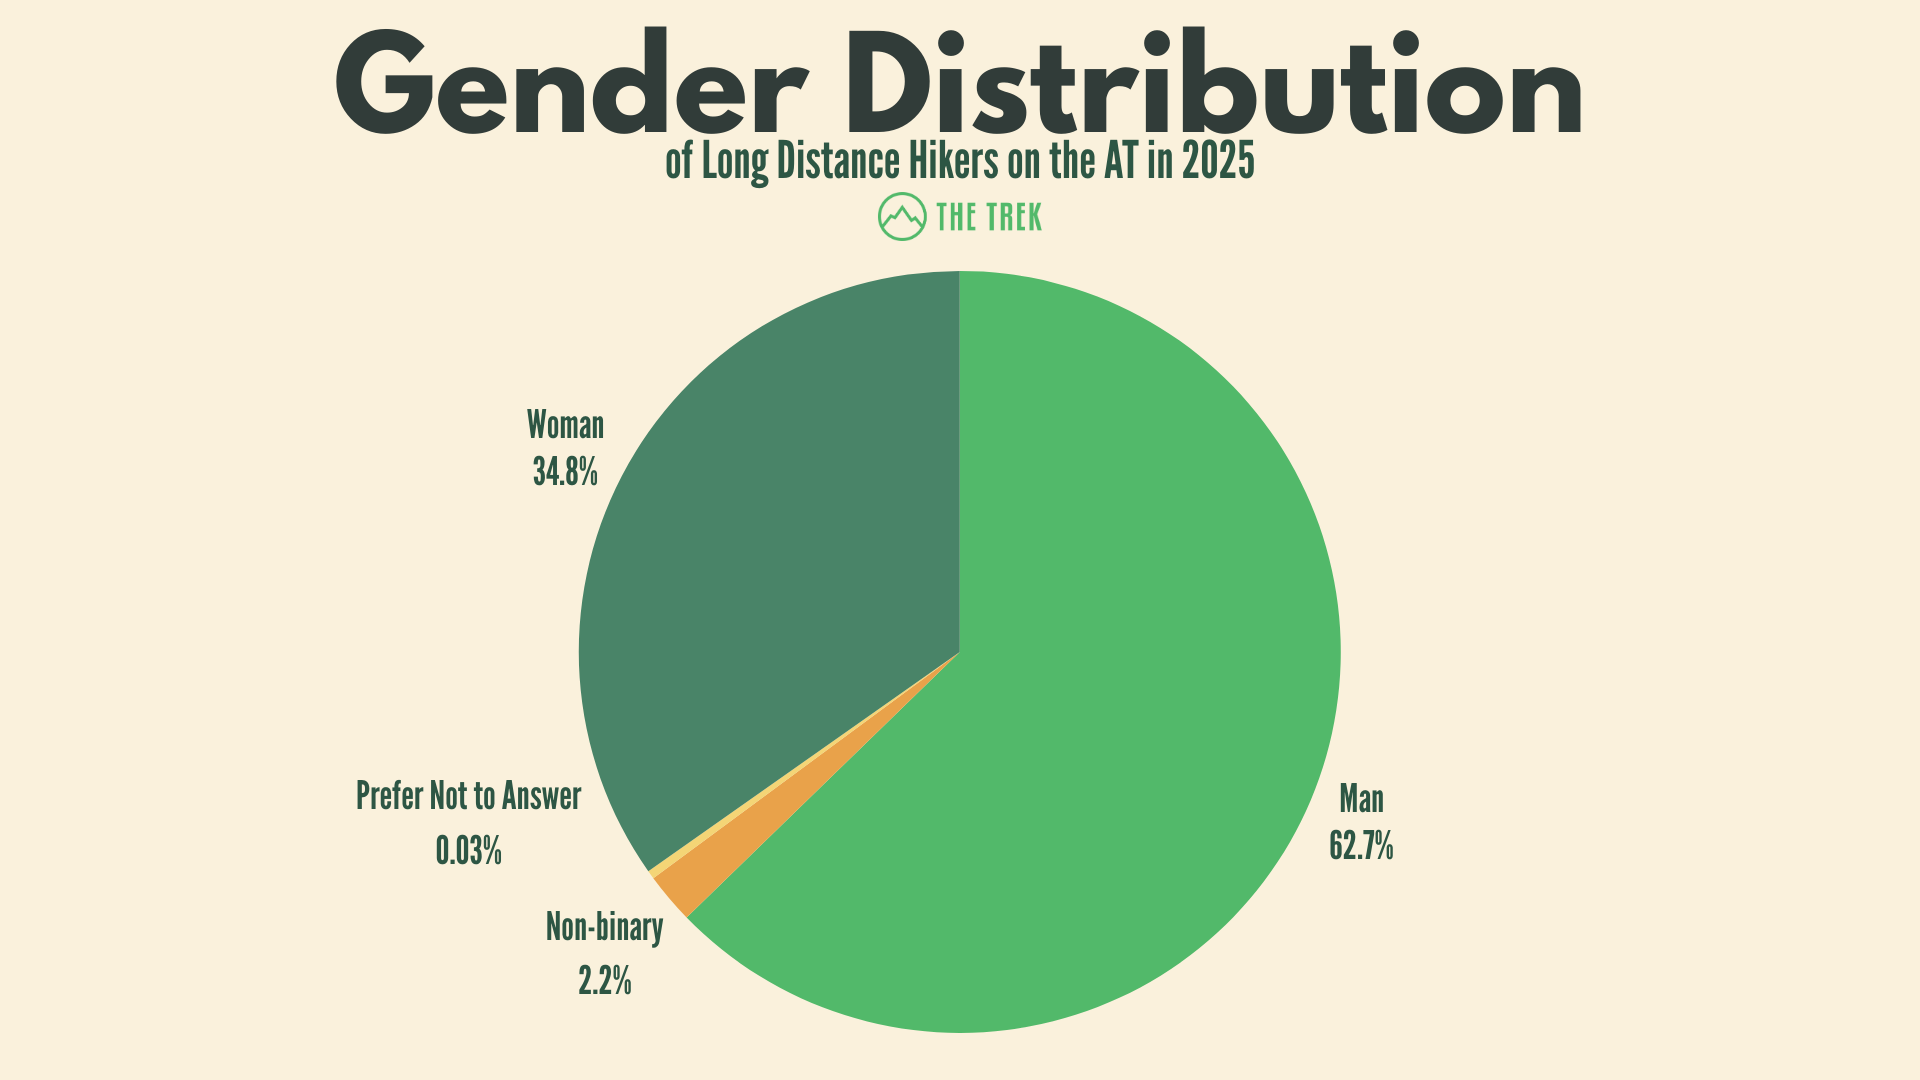
Since 2016, the year The Trek began collecting demographic data for the survey, the gender distribution has fluctuated between around 54 and 63% men. Last year, 63% of survey respondents were men, which was the highest proportion of men to date.
This year, we stay consistent with that proportion of men, while the number of non-binary respondents rose by one percent and responses from women fell by one percent.
Race Distribution
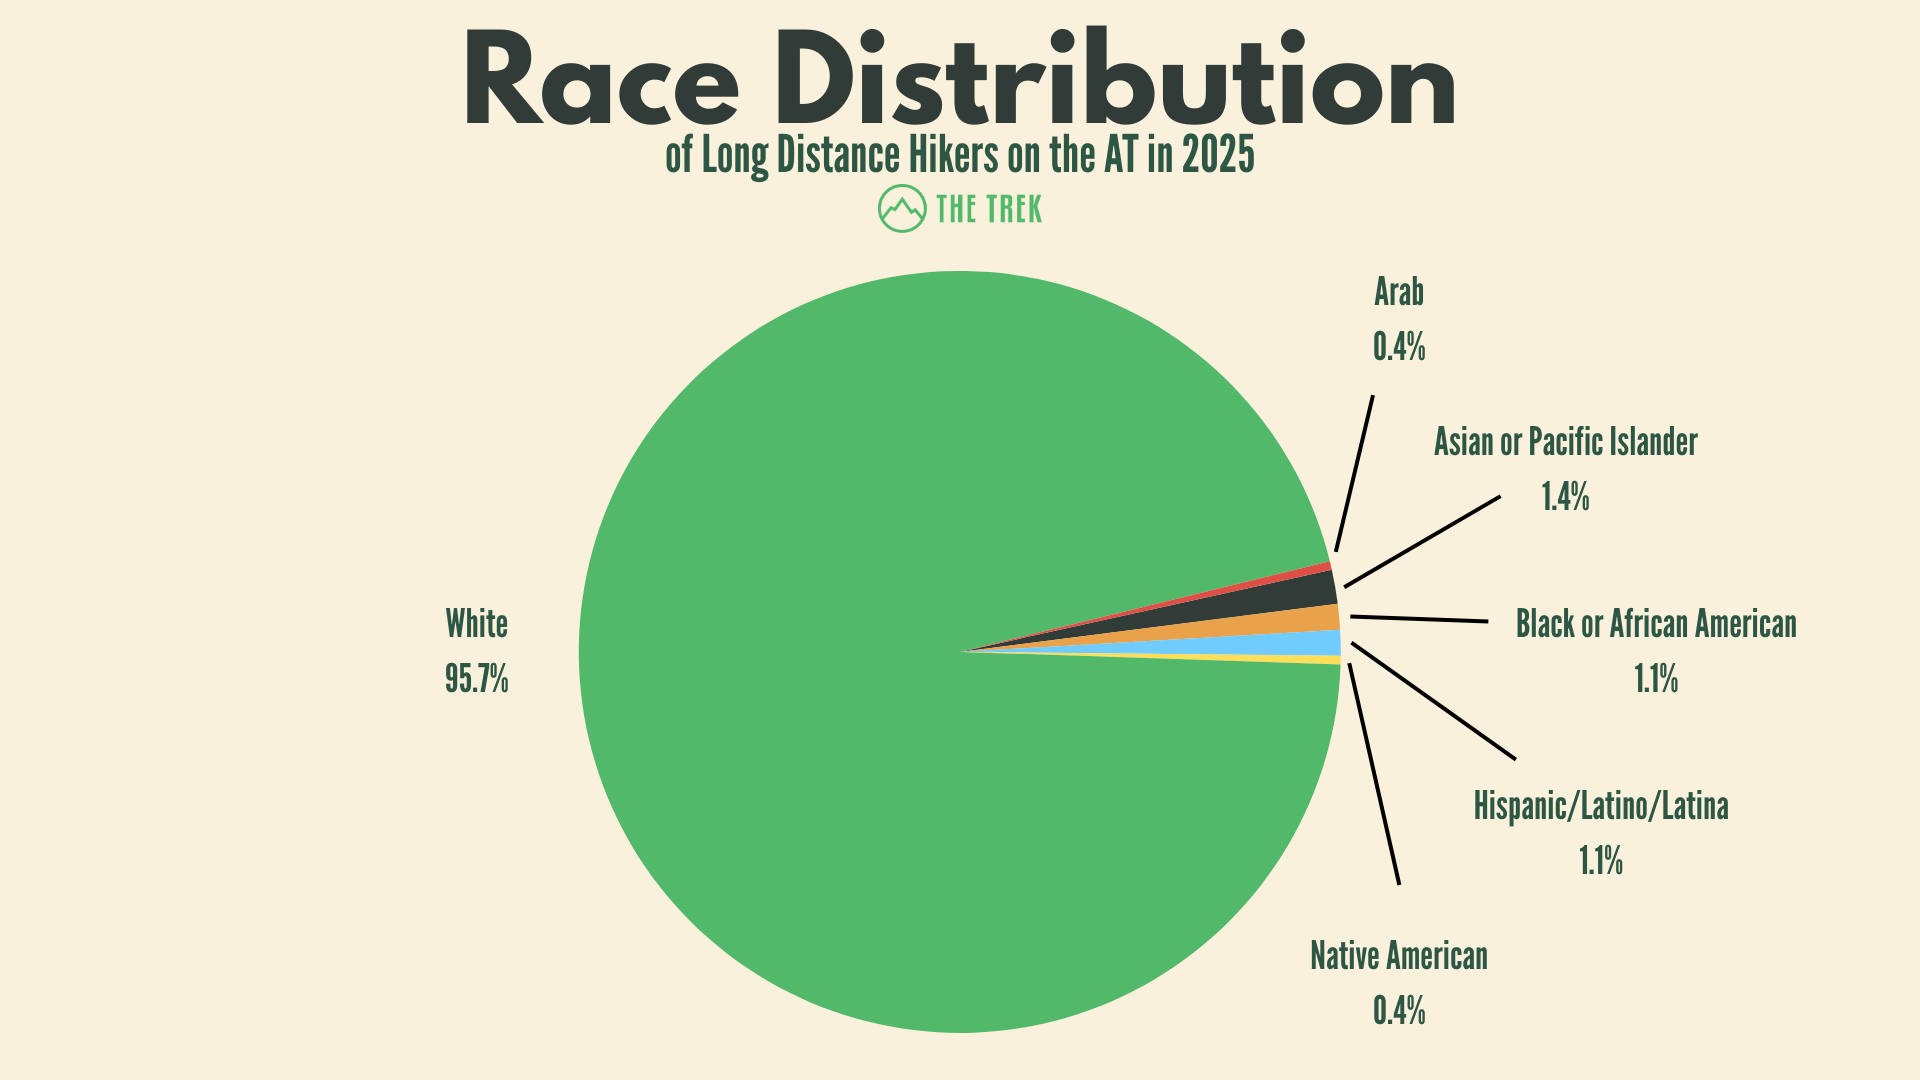
The trail remains overwhelmingly (96%) White, a trend that persists year over year as the proportion of White respondents has consistently landed above 90% since we began collecting demographic data in 2016.
While efforts to diversify the outdoors continue, the demographic data shows that hikers identifying as White still make up the overwhelming majority, with fewer than 5% of hikers identifying as Hispanic, Asian, Black, Arab, Native American, or Pacific Islander.
Home Country and/or State: Where Do Most AT Thru-Hikers Come From?
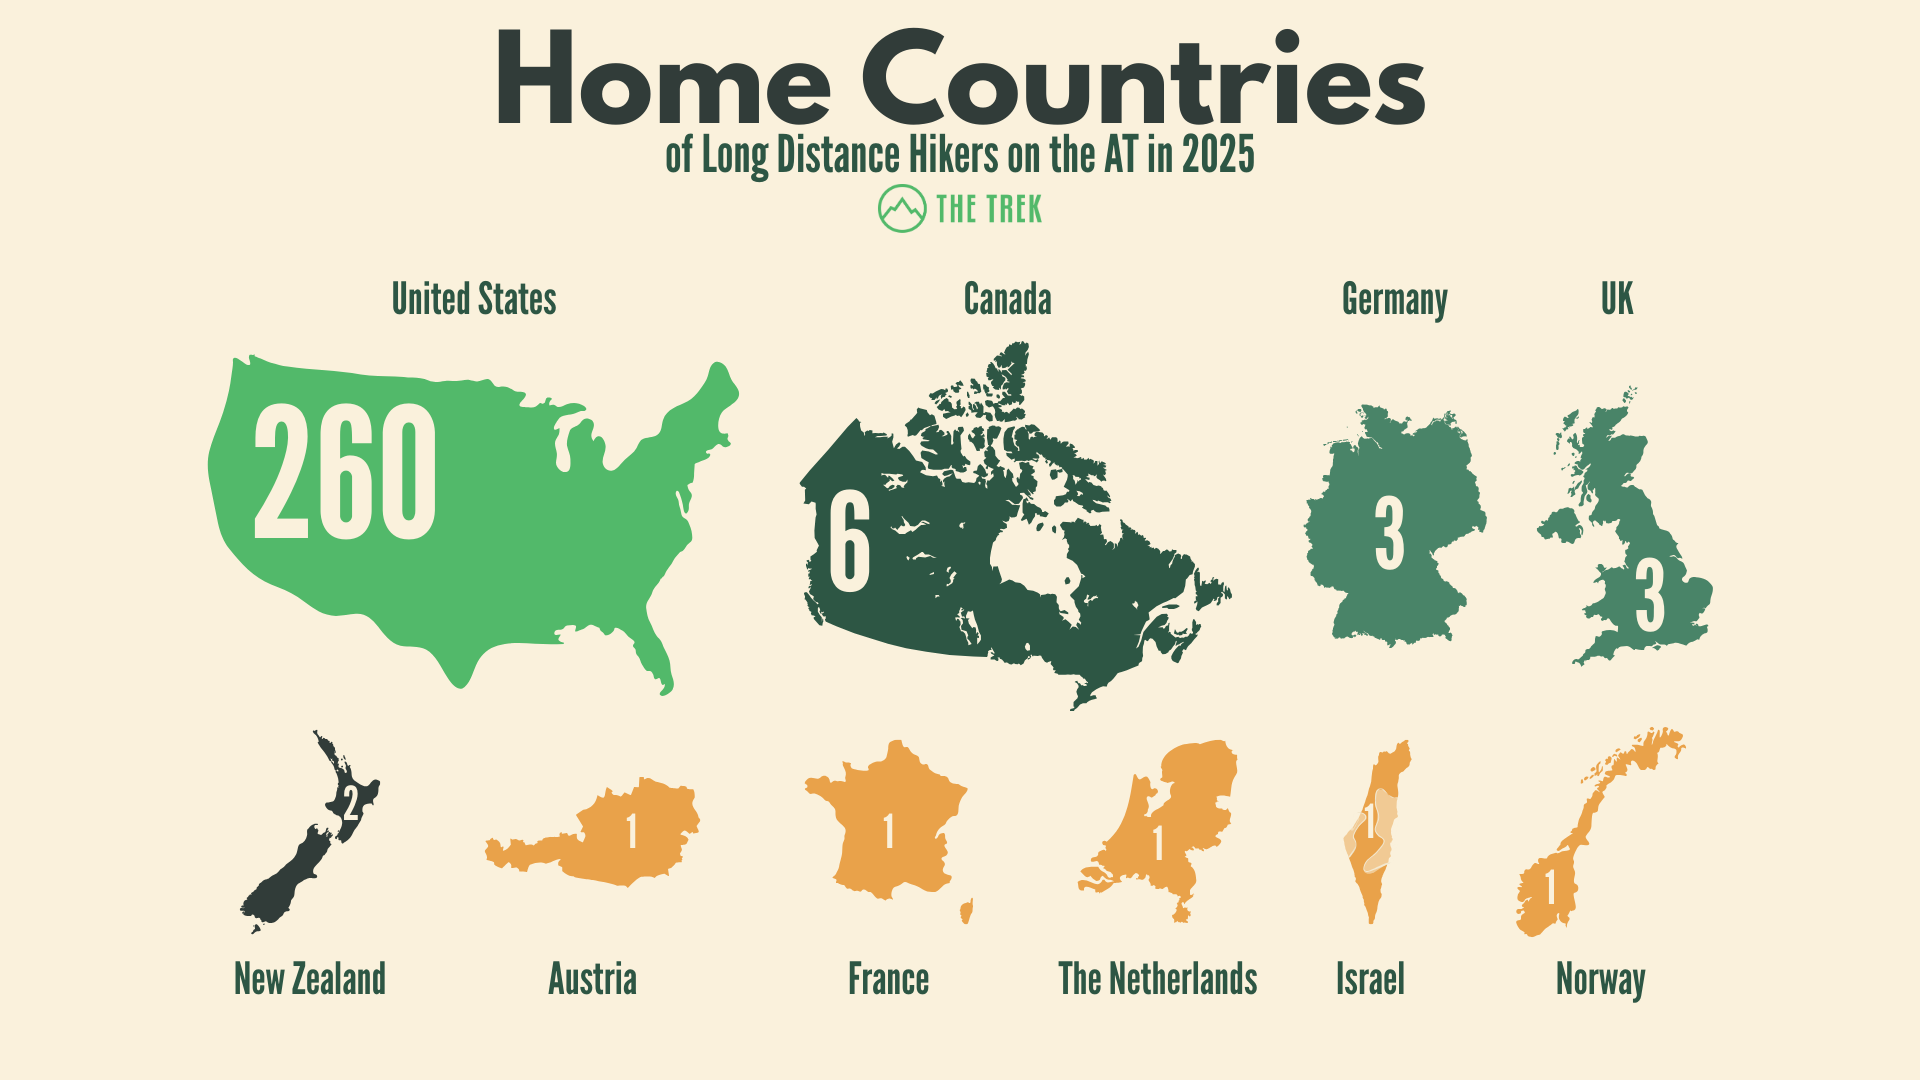
As with previous years, the vast majority of survey respondents in 2025 (93%) were from the United States. Nine other countries were represented among the respondents, with the majority coming from Canada, Germany, and the UK.
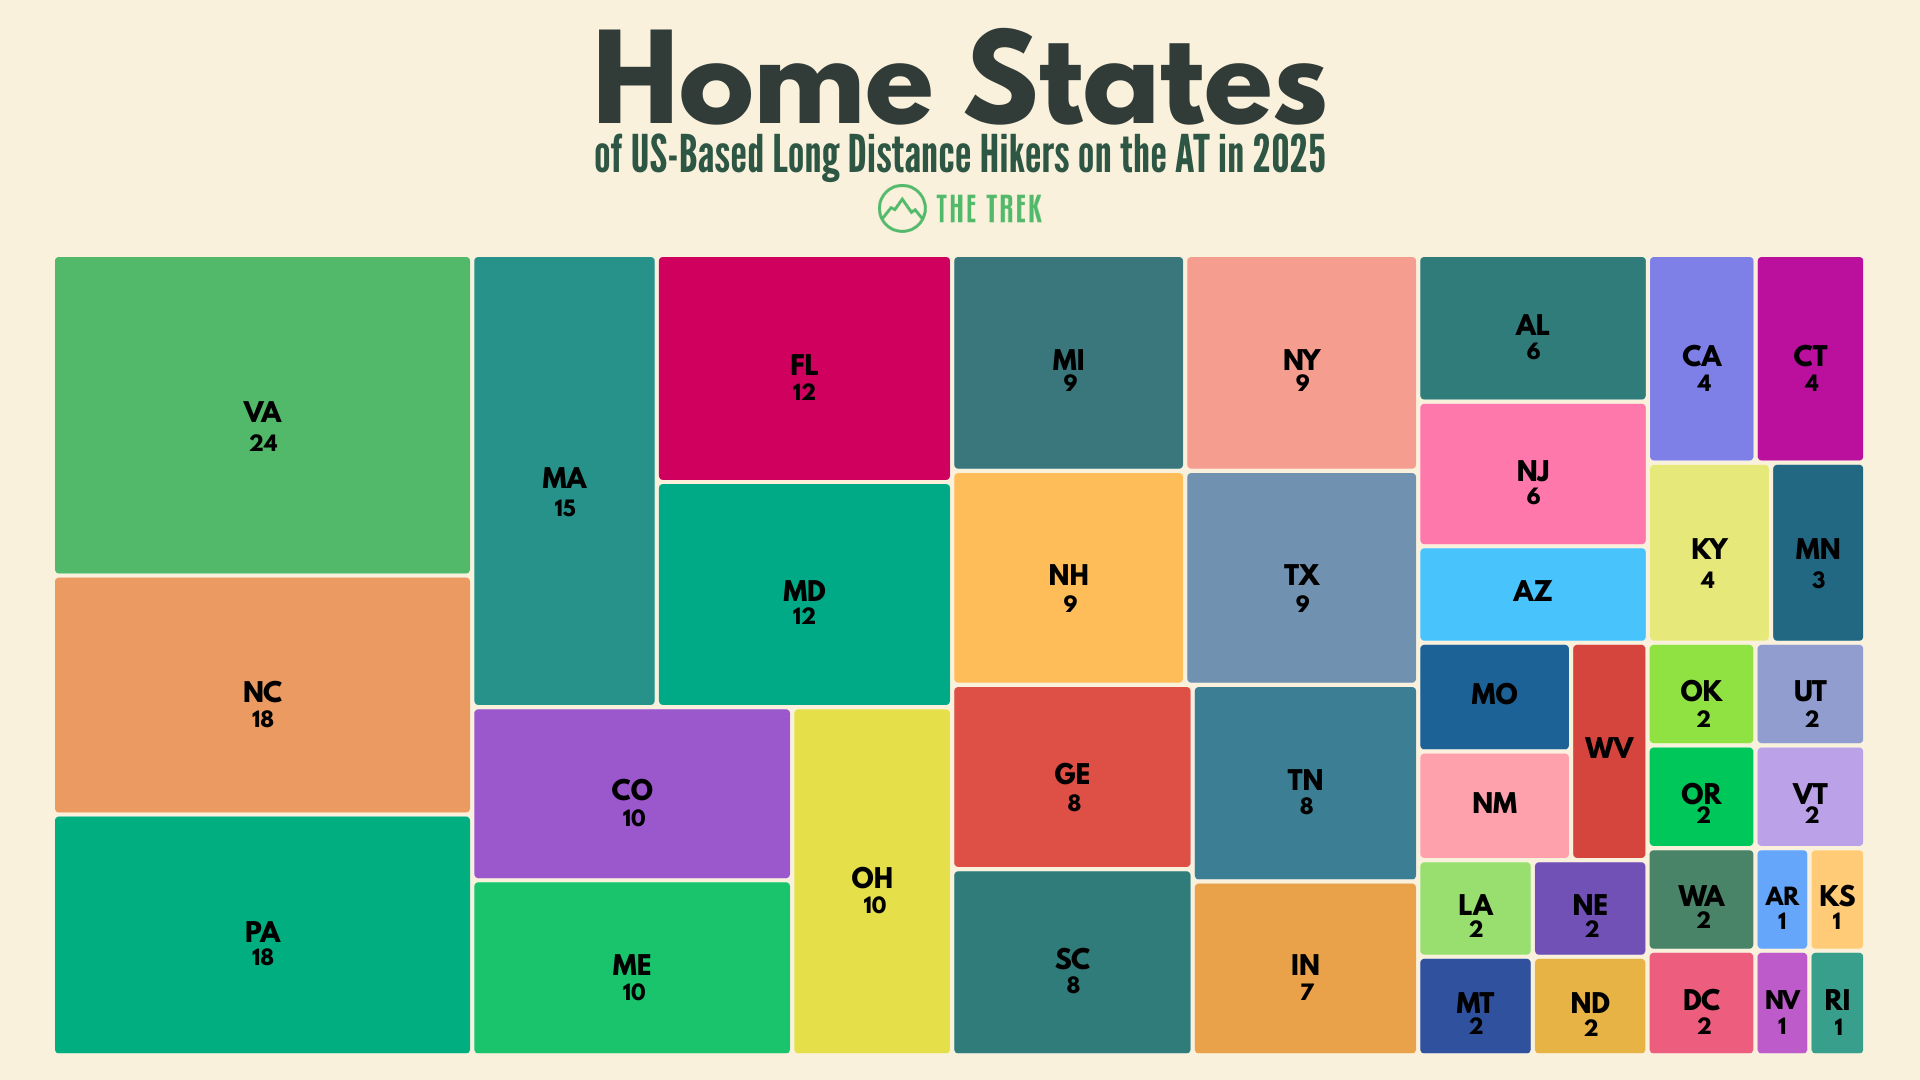
Within the United States, the majority of hikers hailed from eastern states, with the exception of the 10 respondents from Colorado.
As in previous years, we hypothesize that hikers from east coast states are more likely to hike the trail, as they are geographically closer. Hikers from these states are more likely to have had previous experiences on the Appalachian Trail and might face easier logistics in accessing the trail.
The states with the most respondents this year were Virginia, North Carolina, Pennsylvania, and Massachusetts, respectively — all AT states.
Education
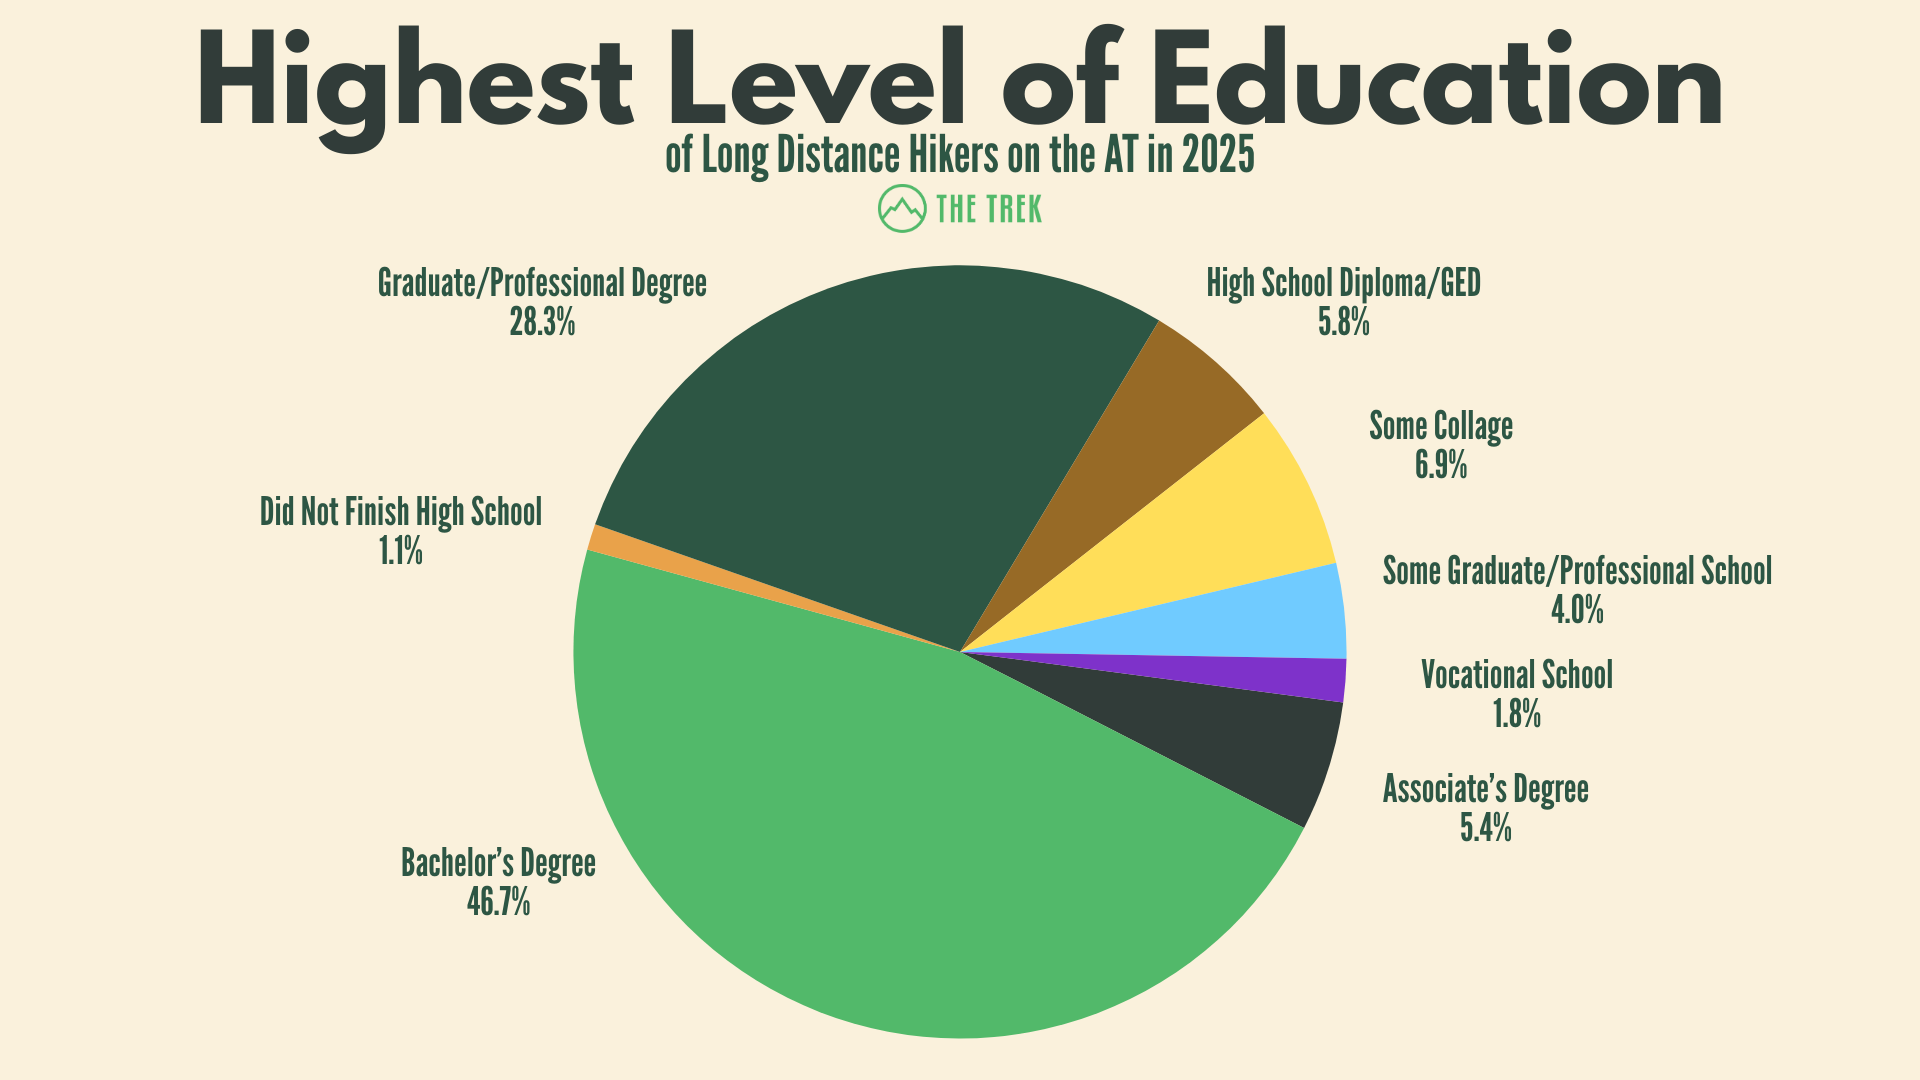
Education levels did not change wildly from the 2024 responses — as in previous years, our survey indicates that Appalachian Trail thru-hikers are highly educated, with three-fourths of respondents holding a Bachelor’s or graduate/professional degree.
This year, we had three respondents under the age of 18, which accounts for the responses indicating not having finished high school.
Occupation: What Jobs Do Most Thru-Hikers Have That Allow Them Time Off To Hike?
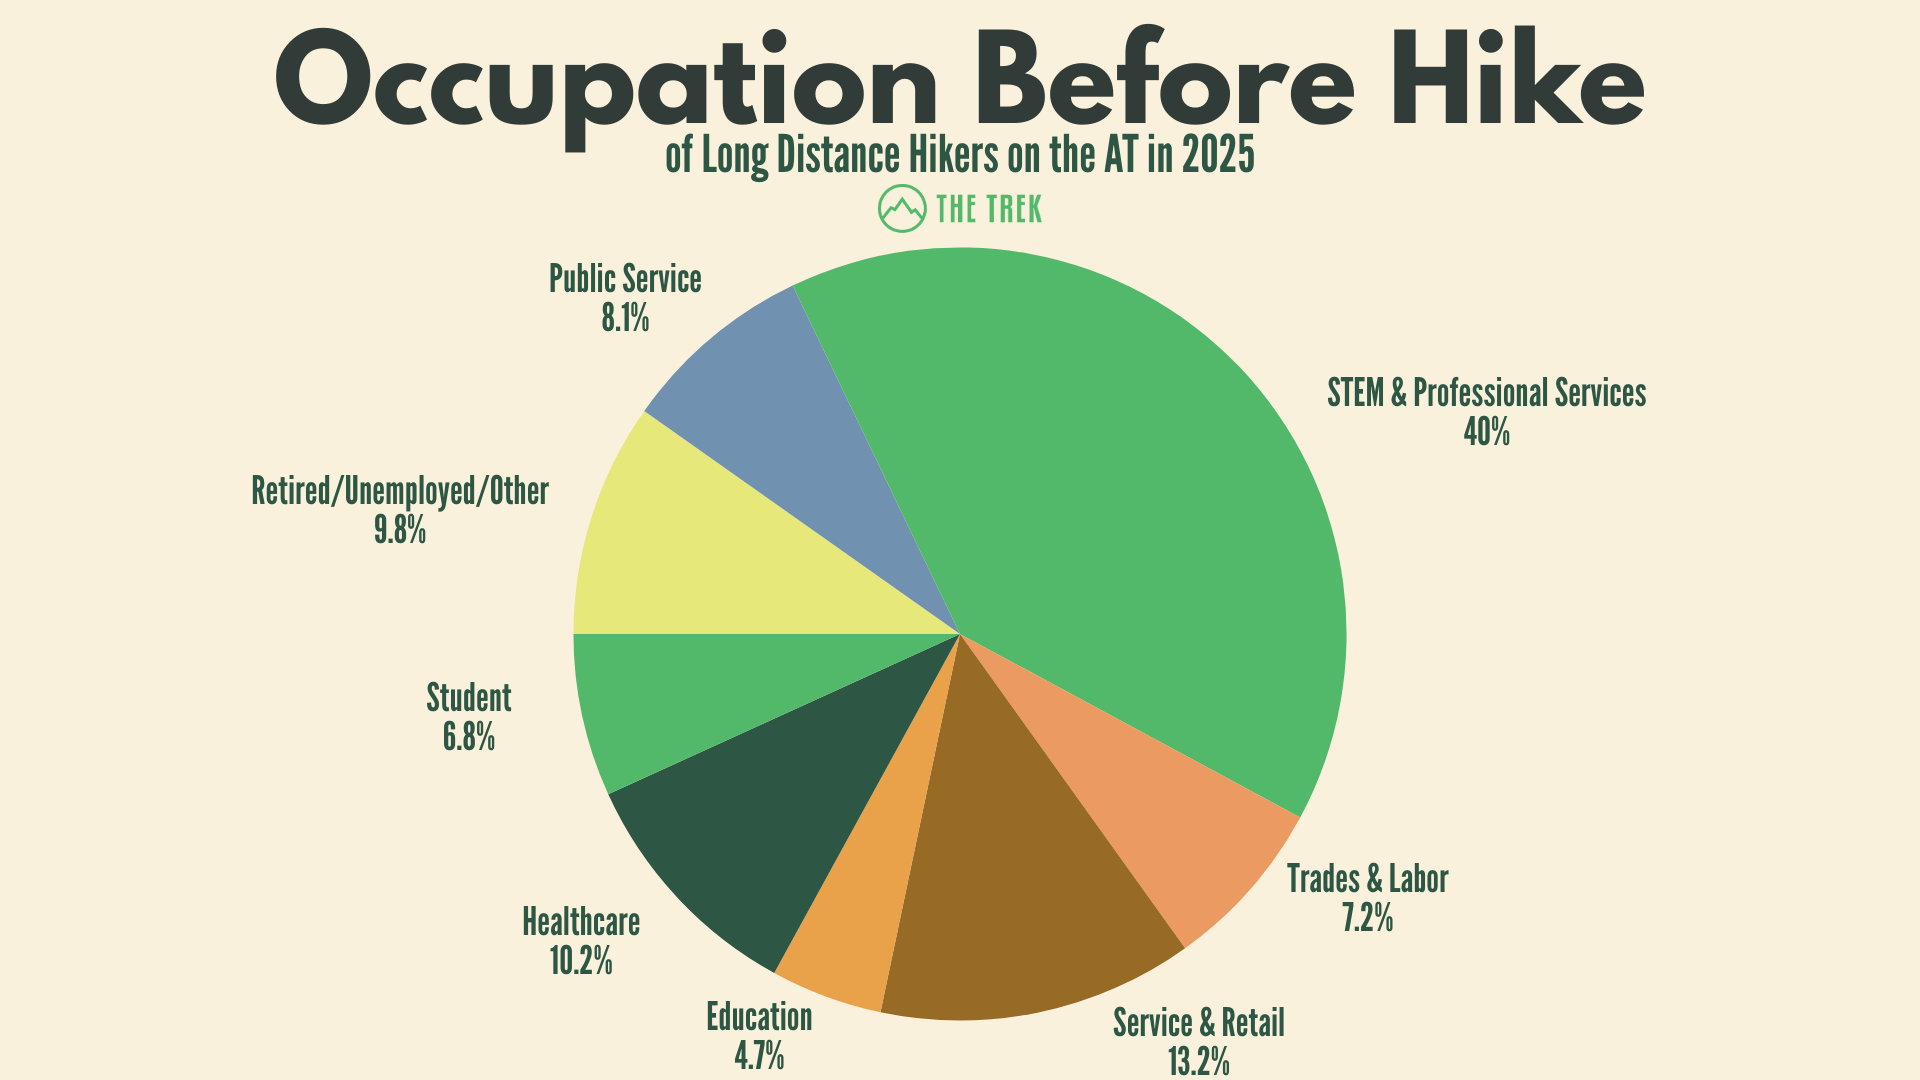
This year, respondents hailed from over 200 distinct occupations before starting the trail. We’ve grouped them into the above categories, with STEM & Professional Services (Engineering, Technology, Science, Finance, Law, and Corporate Administration) accounting for 40% of responses.
Students (6.8%) and Educators (4.7%) also make up a large chunk of respondents, likely because they have summers off. Indeed, when we asked participants how they got the time off from work to thru-hike, nearly 8% cited having summers off.
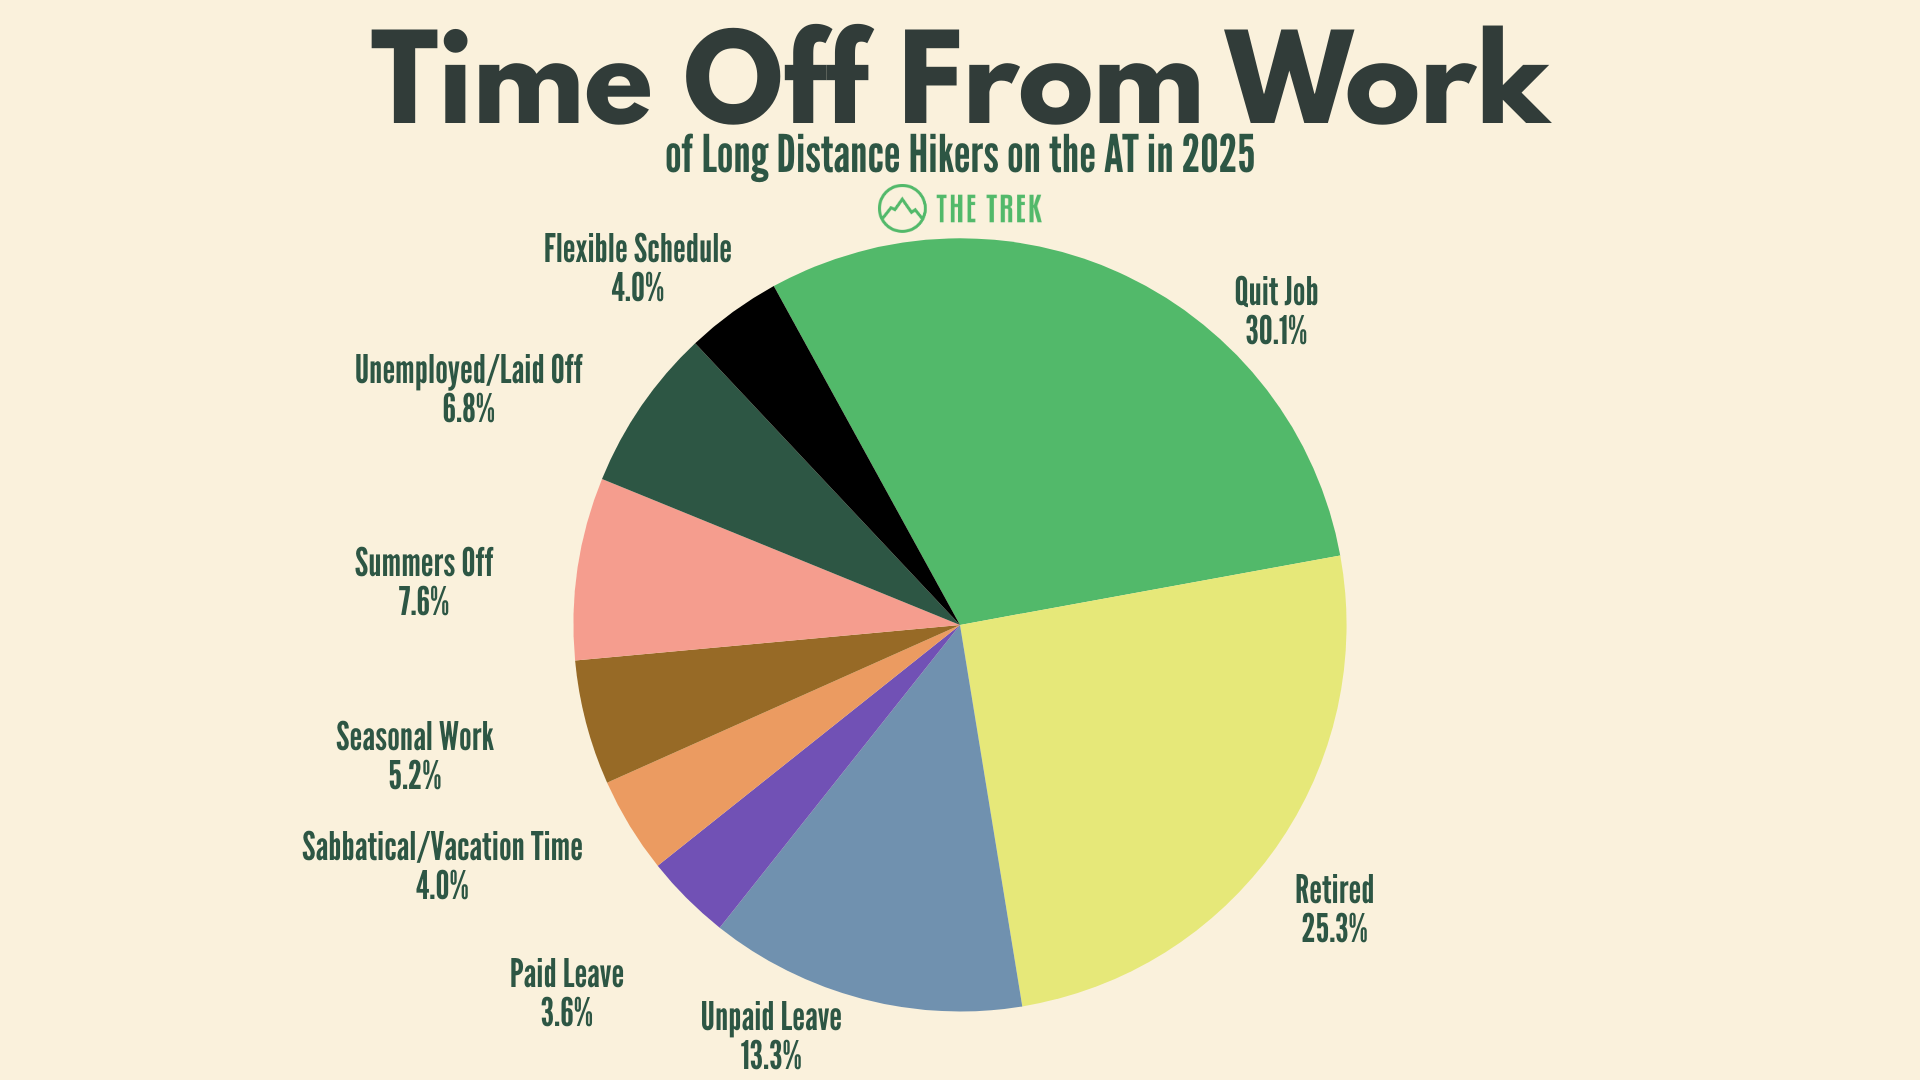
Like last year, about a third of 2025 respondents quit their jobs to hike. The number of retired respondents rose 6% since 2024, and these two categories combine to make up over 50% of the responses.
Hiking Basics
How Much Prior Hiking Experience Do Most AT Thru-Hikers Have?
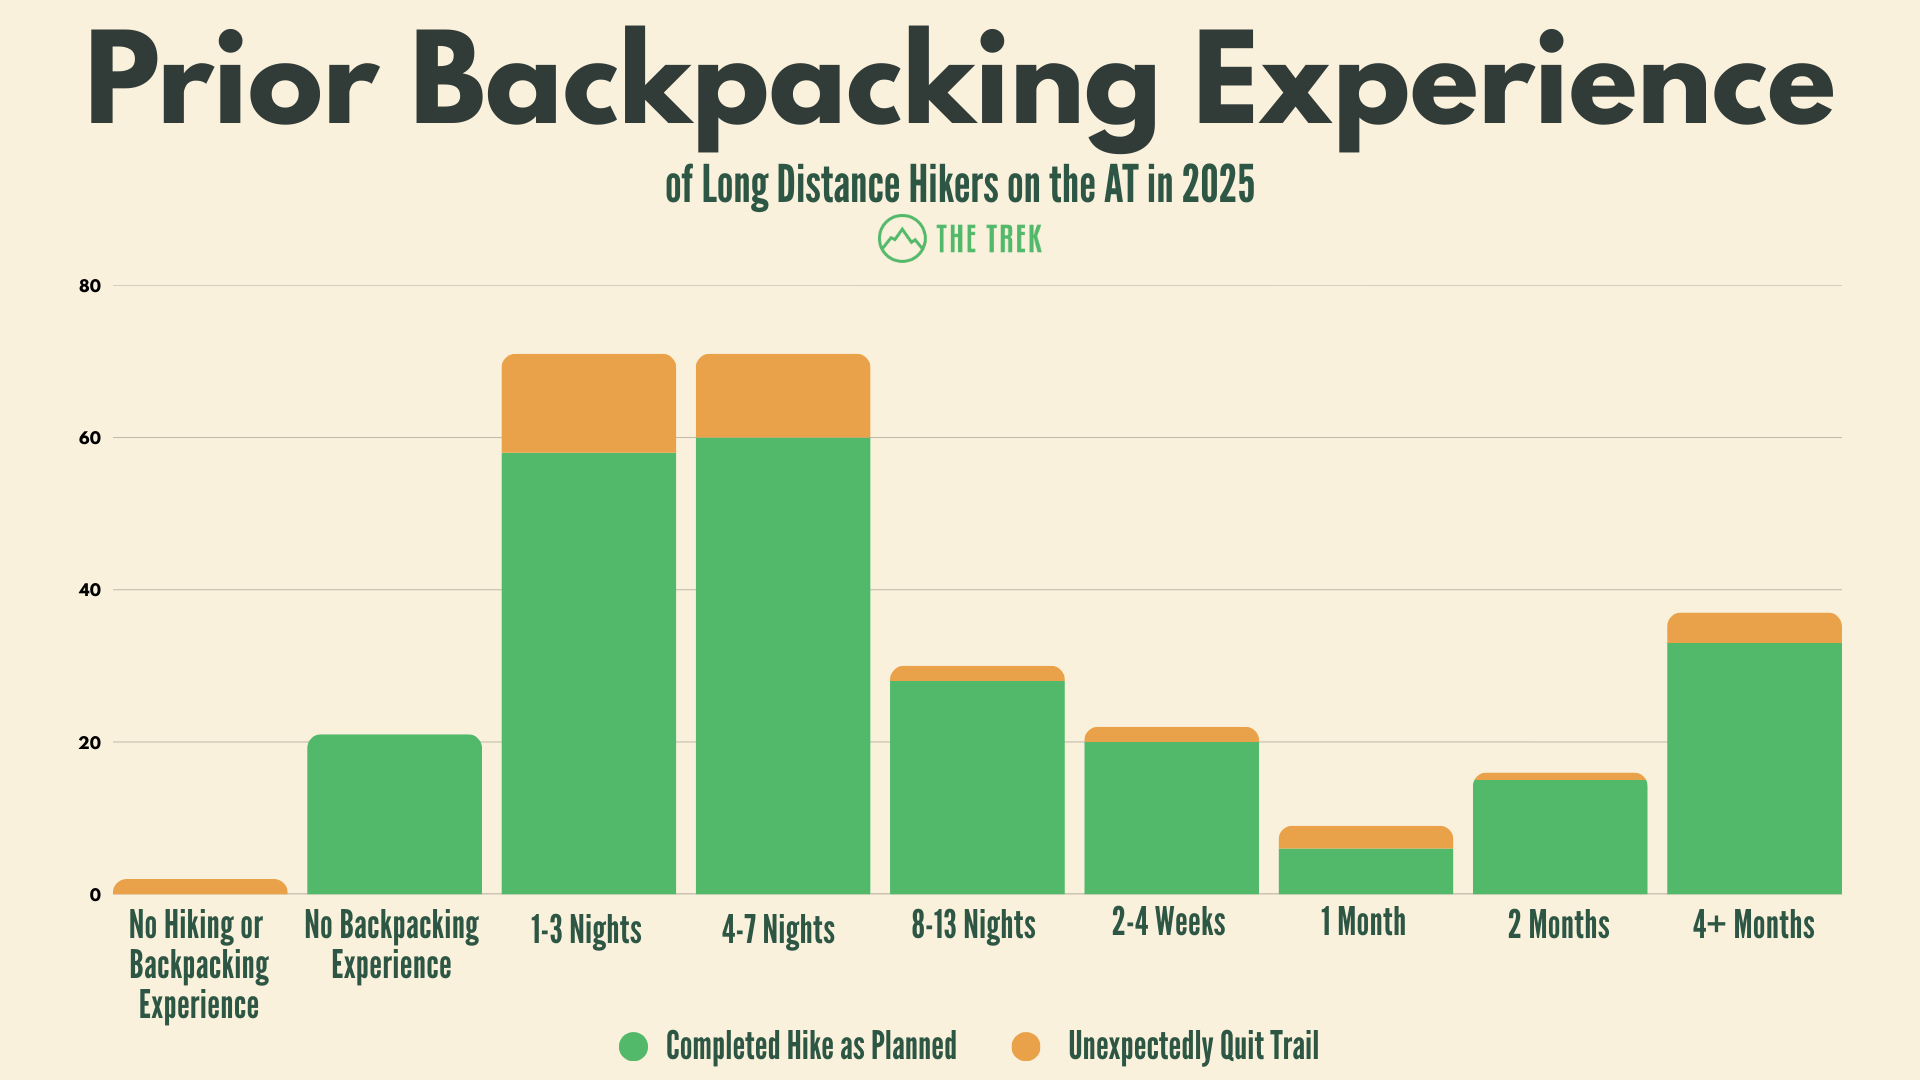
The average hiker on the Appalachian Trail in 2025 had between one and seven nights of prior backpacking experience, with very few respondents having no hiking or backpacking experience at all. A larger spike happened at the 4+ months of experience, likely from hikers attempting the Appalachian Trail after a previous thru-hike.
This year, we compared the rates of successful hike completion across these categories (as seen above in orange). Notably, the group of respondents reporting hiking experience, but no previous backpacking experience, also reported a 100% success rate of completing their hikes as planned. The rate of quitting the trail unexpectedly did not vary much across the other experience levels, confirming the idea that the Appalachian Trail is a great first thru-hike.
Two hikers started not only with no previous backpacking experience, but with no hiking experience whatsoever; both reported ending their hikes before they had planned.
How Many Hikers Completed the Whole AT in 2025?
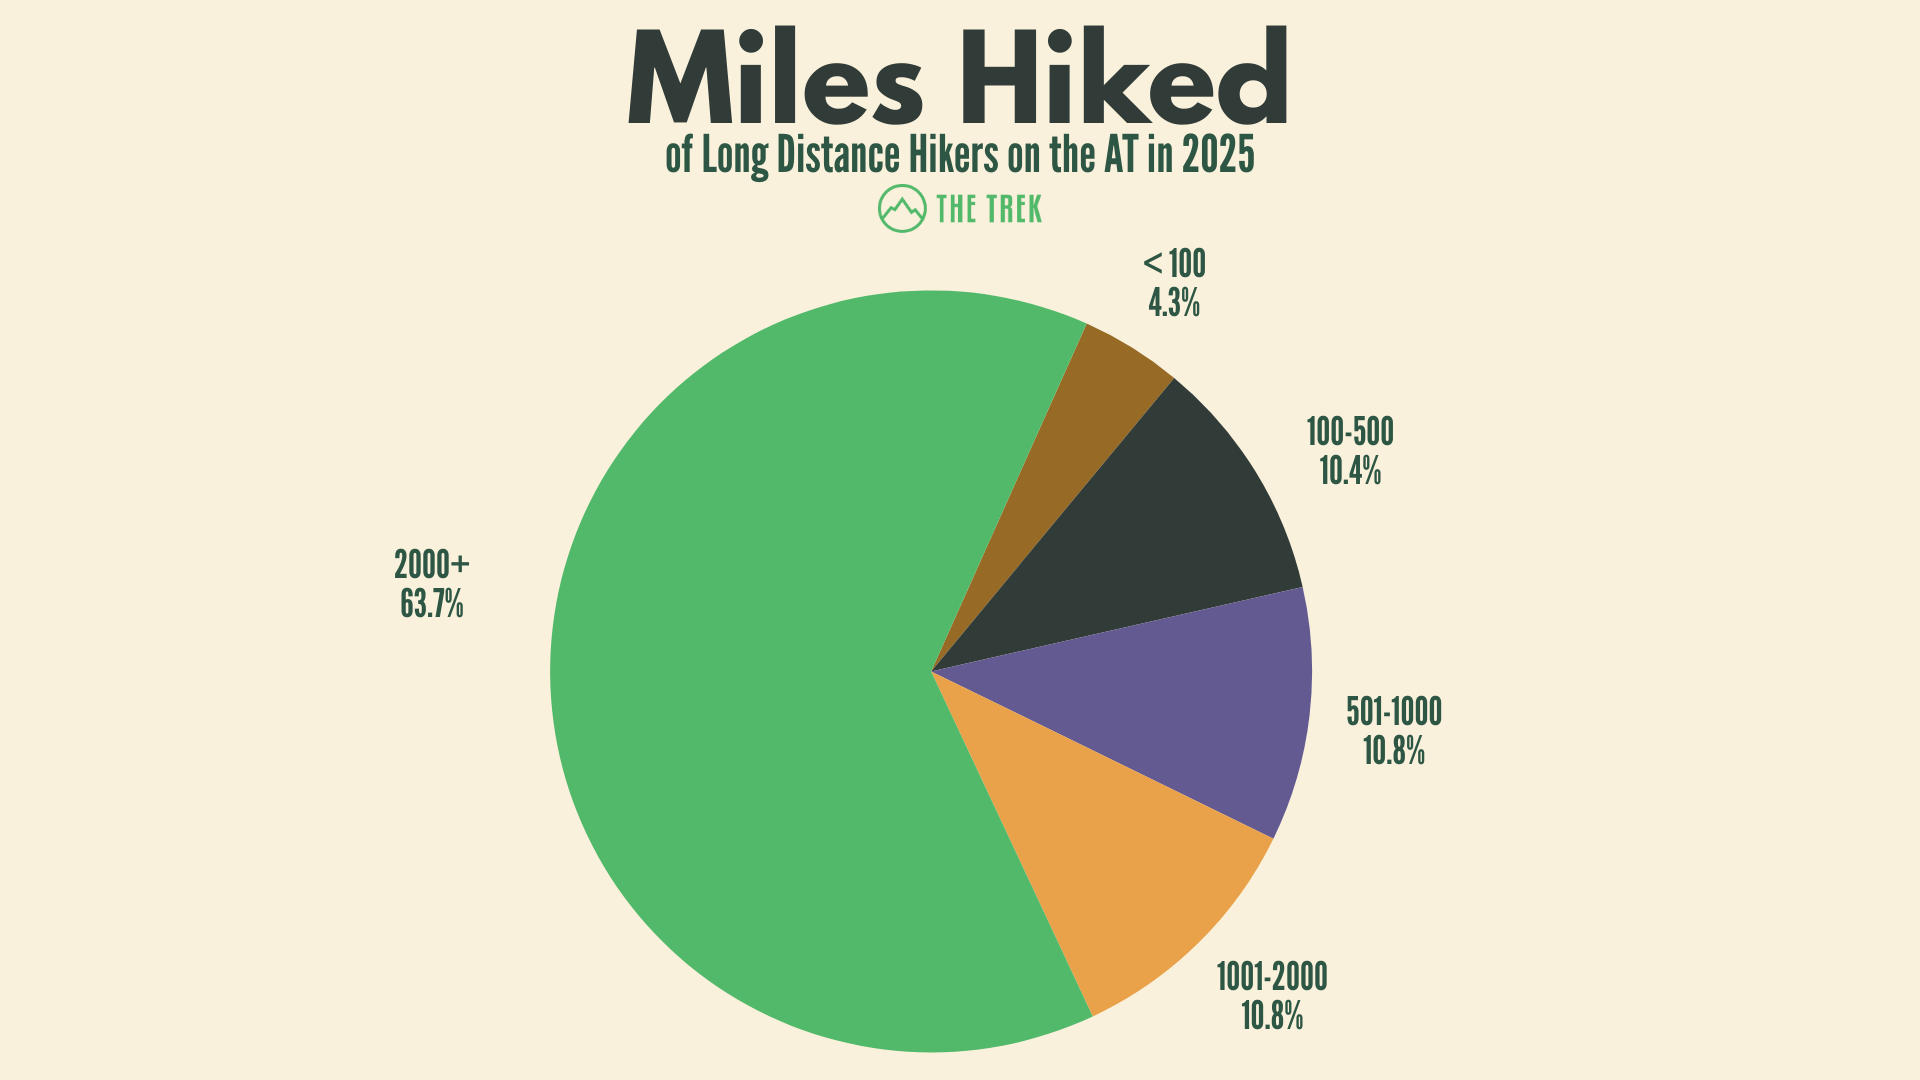
This year, 63.7% of respondents completed thru-hikes with over 2,000 miles hiked, which is lower than last year’s rate of 71%. However, this continues to trend much higher than the numbers reported by the Appalachian Trail Conservancy (ATC), which typically reports around a 30% success rate. There are several reasons for this disparity.
First, the ATC has access to a much larger dataset, as the majority of hikers seem to register their hikes with the ATC. Secondly, we can only advertise our survey to our readers and Instagram followers, meaning we likely draw responses from those voluntarily plugged in to the thru-hikers space. As we speculated (boasted) last year, we like to think readers of The Trek are more prepared for the demands of thru-hiking after reading our articles and engaging with our content.
Even if that’s not true, please let us continue believing that it is. My self-esteem needs it.
Top Reasons AT Thru-Hikers Didn’t Finish This Year
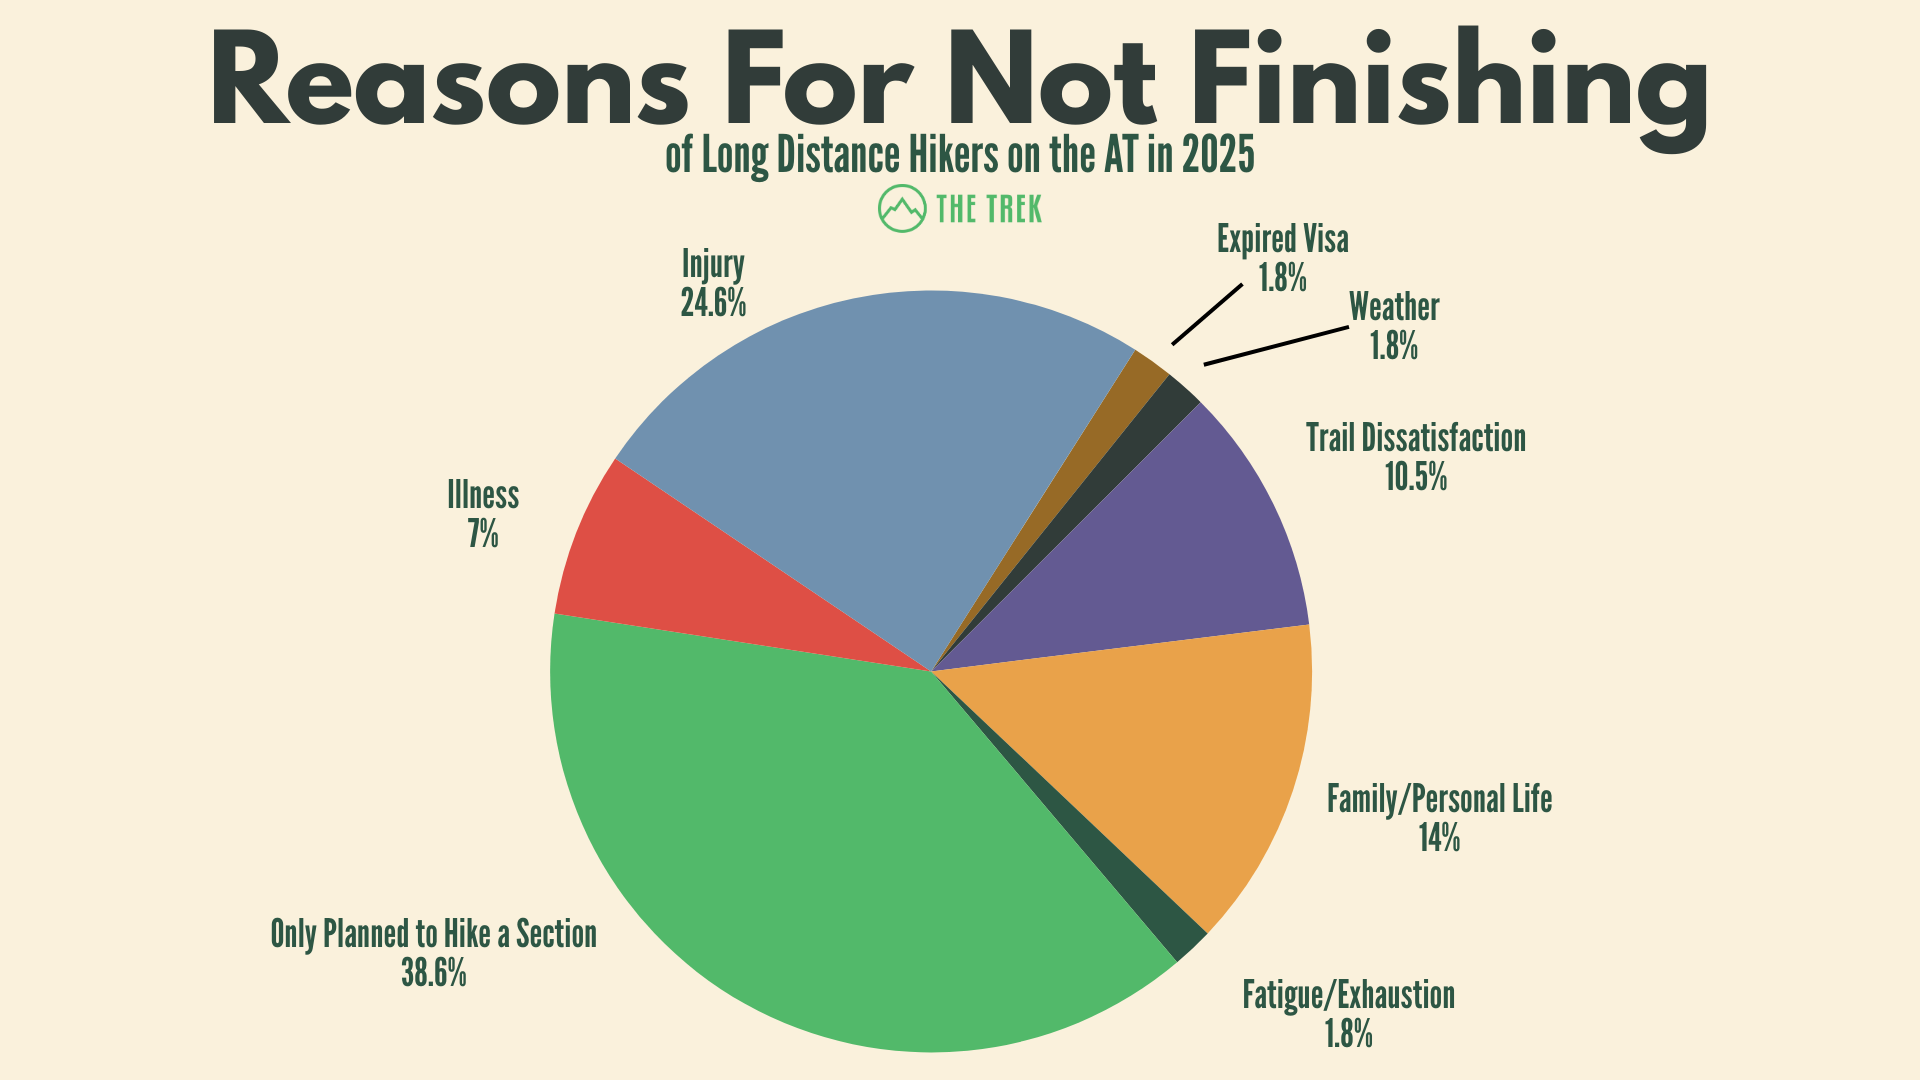
43 survey respondents this year did not complete a thru-hike. Of that cohort, 39% said they only intended to hike a section to begin with. This percentage of planned section hikers has risen 12% since 2024, and is now more consistent with the numbers we saw back in 2023.
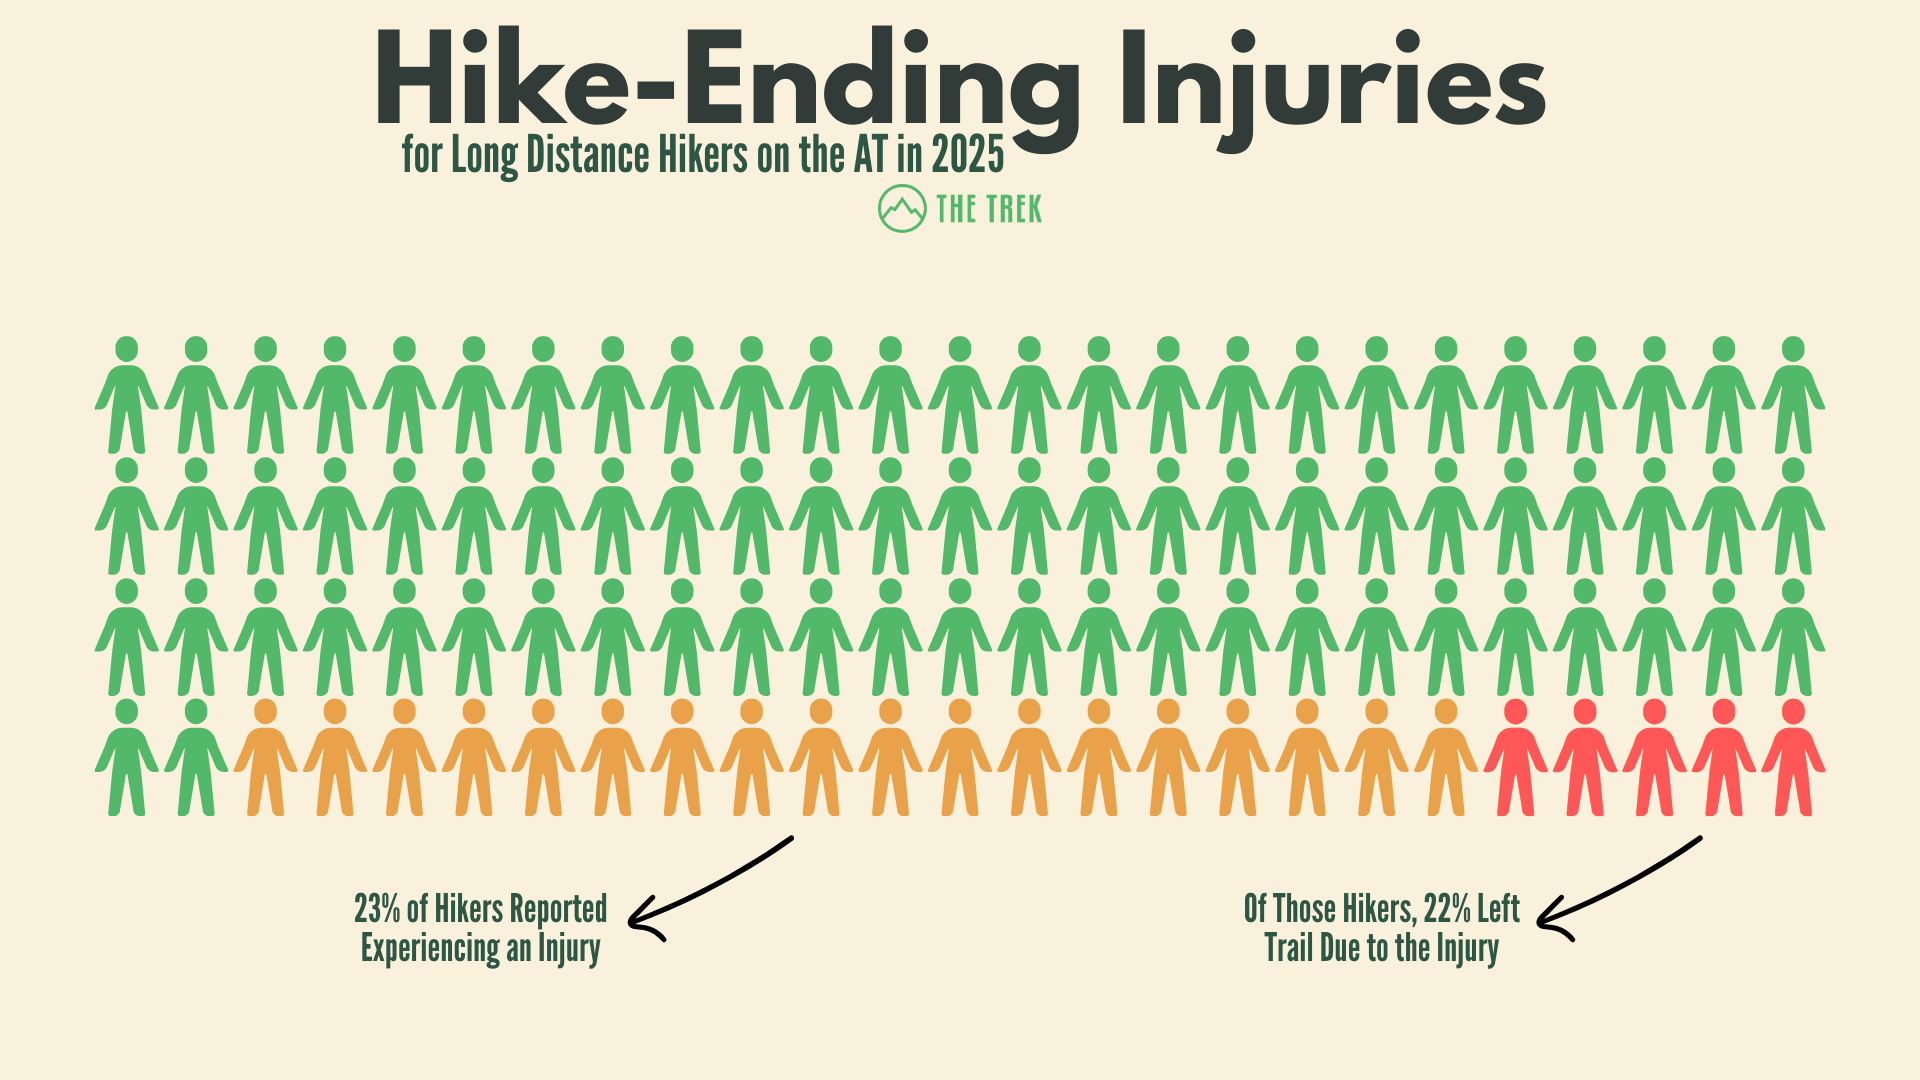
When we look at the reasons that those planning to thru-hike needed to leave the trail, we see similar answers as from previous years, with injury and family/personal life accounting for the majority.
Though the number of unplanned trail exits shrank in 2025, the percentage caused by injury has risen nearly 5% from 2024. Interestingly, this is the first year in a while that “Finances” (e.g., running out of money) did not account for any of our respondents’ unplanned exits.
Another deviation from 2024 comes from the small number of hikers (1.8%) exiting the trail due to weather. Last year, Hurricane Helene, flooding, and rain caused 8% of the reported exits from the trail.
One important note about this data: though we advertise this survey to the best of our ability, many hikers who unexpectedly did not finish the trail are likely not engaging with Appalachian Trail-related media by the time autumn rolls around.
Therefore, this data is very likely heavily skewed towards those who completed their hikes as planned, and we probably are not seeing the full picture of why hikers needed to exit the trail early.
In Which Direction Did Most People Hike the AT in 2025?
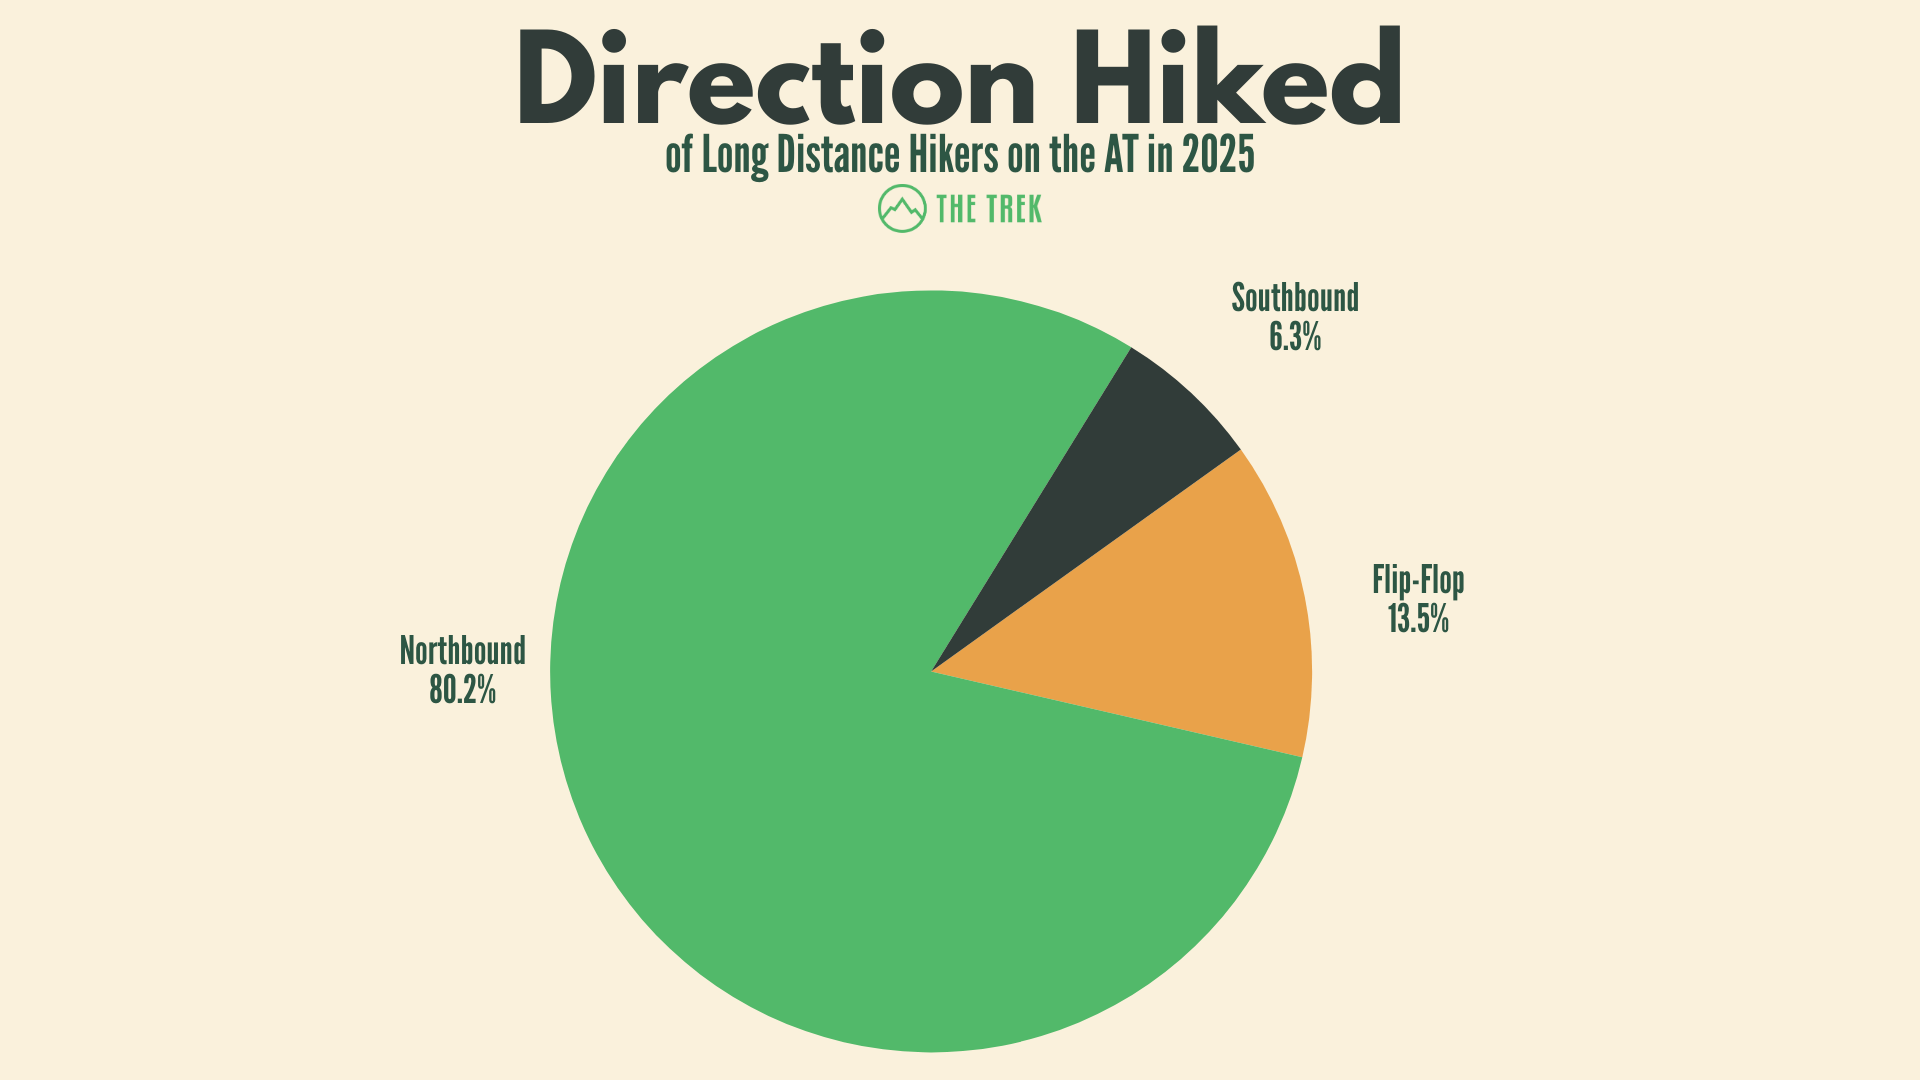
This year, we saw a noticeable (8%) decrease in the proportion of Northbound hikers, though they still made up the vast majority of our respondents. We saw a 4% rise in Southbound respondents, as well as a 4% rise in the number of respondents who chose to flip-flop (not hike in one continuous direction for the entirety of the hike).
The ATC and many media outlets, including The Trek, encouraged hikers to consider a southbound or flip-flop itinerary for 2025 after Hurricane Helene devastated portions of the southern AT last fall in order to give towns and trail crews more recovery time, which may account for the dip in Northbound traffic.
As more people begin to talk about the benefits of a Southbound thru-hike, I expect to see this number continue to rise.
When Do Most People Start the AT?
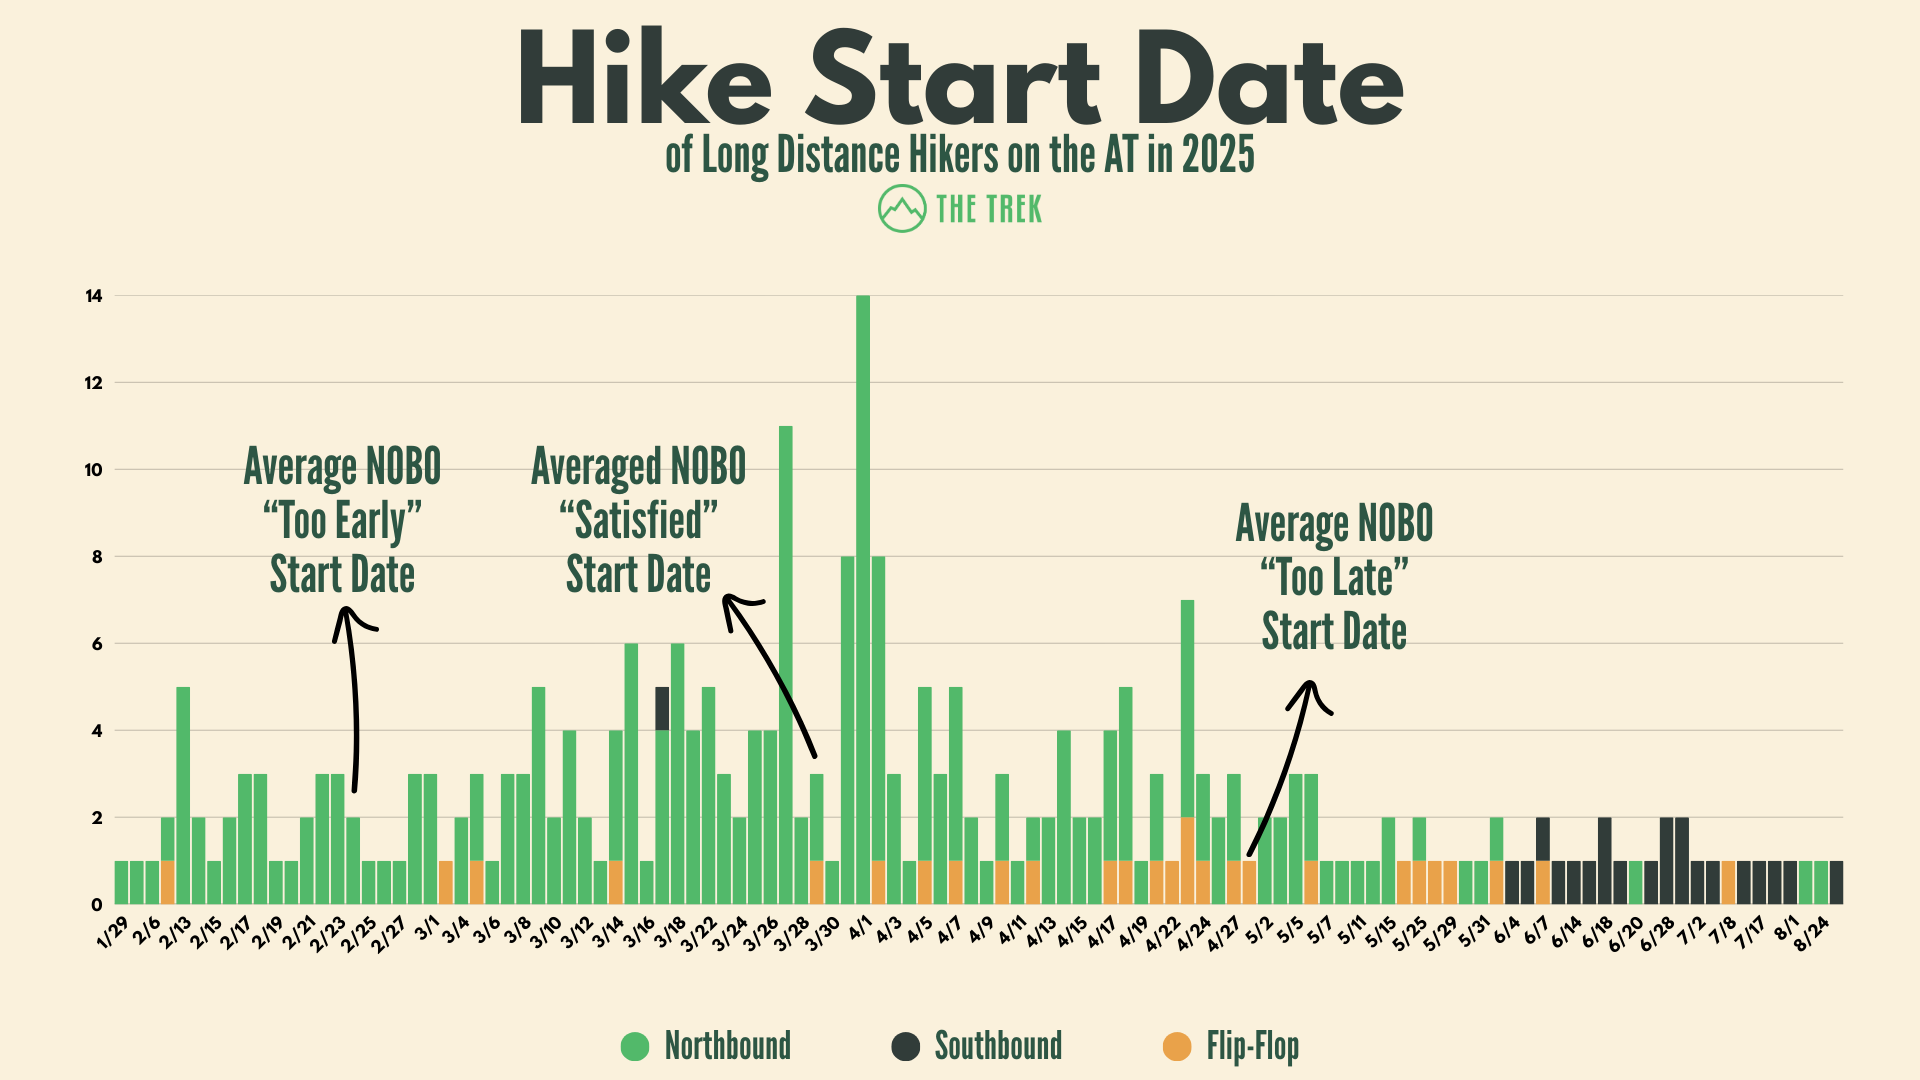
Most hikers began their hikes in March and April, with the single most-reported start date being April 1.
We asked respondents if they were satisfied with their start dates; the average start date for satisfied NOBO hikers was March 29, while the average dates reported as too early and too late were February 23 and May 2, respectively. However, 89% of respondents reported satisfaction with their start dates, so what you’re happy with will ultimately boil down to the type of trail experience you’re hoping to have.
So if you want to start in what many thru-hikers seem to consider the “sweet spot” for northbounders, aim for a late March/early April start (but know that this will have implications for the amount of crowding you’re likely to experience).
Hikers who said they started too late tended to cite weather issues or stress about reaching Katahdin in time. A handful of hikers who thought their mid-March start dates were too late blamed crowds. Fewer hikers said they started too early, but those who did mainly said they wanted to be around more people and that the weather on-trail was too cold.
Southbound hikers tend to start later, typically around June or July, to avoid snowy conditions up north. We did not have enough responses to meaningfully track the satisfaction rate by date.
When Do Most People Finish the AT?
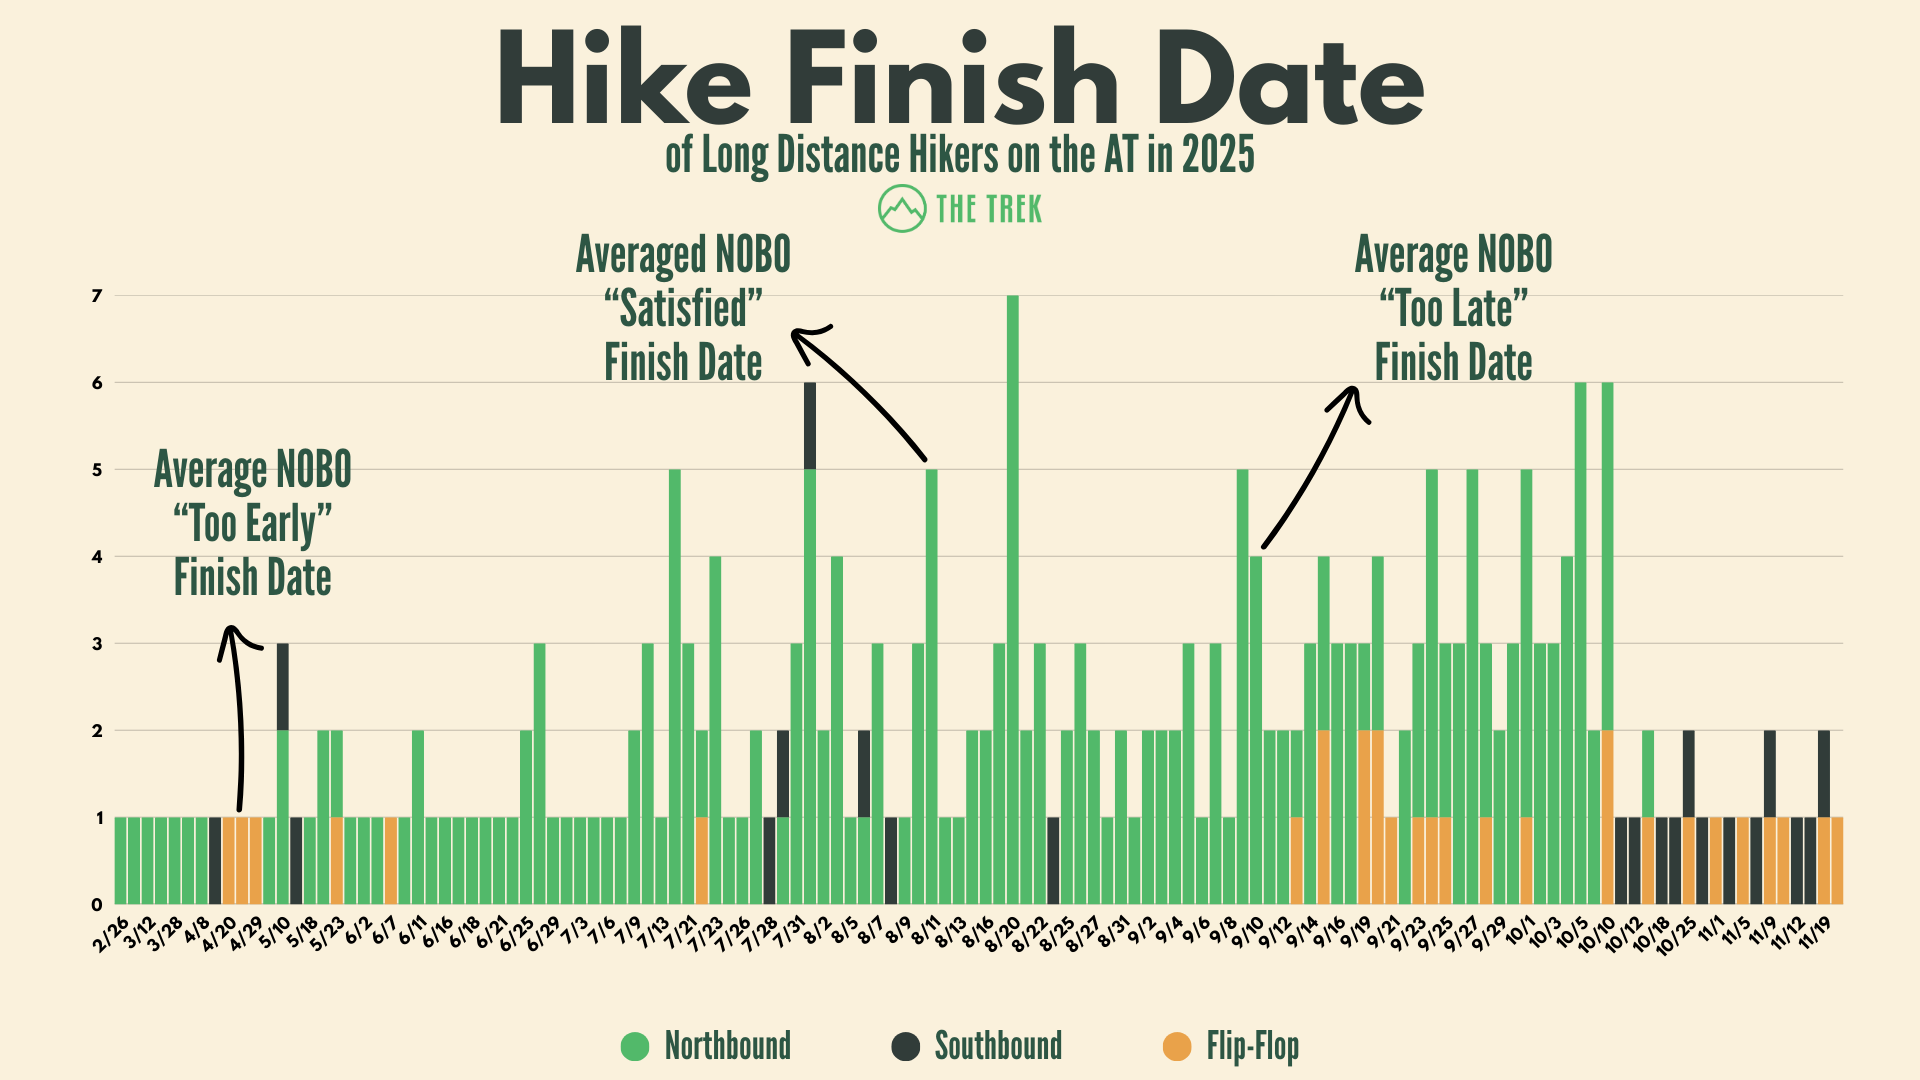
Most hikers finished their hikes between mid-July and early October. Three Southbound section hikers reported finishing between April and May, but it should be noted that they did not start that early in Maine, with Baxter State Park often only open between the months of May and October.
The average finish date northbound hikers were satisfied with was August 11, while the average finish date reported as too late was September 11.
Notably, many Southbound hikers don’t finish the trail until mid-October through the end of the year; The smaller proportion of Southbound respondents to this survey could in part be caused by the timing of the survey itself compared to the typical SOBO finish date.
How Long Did Most People Take To Thru-Hike the AT This Year?
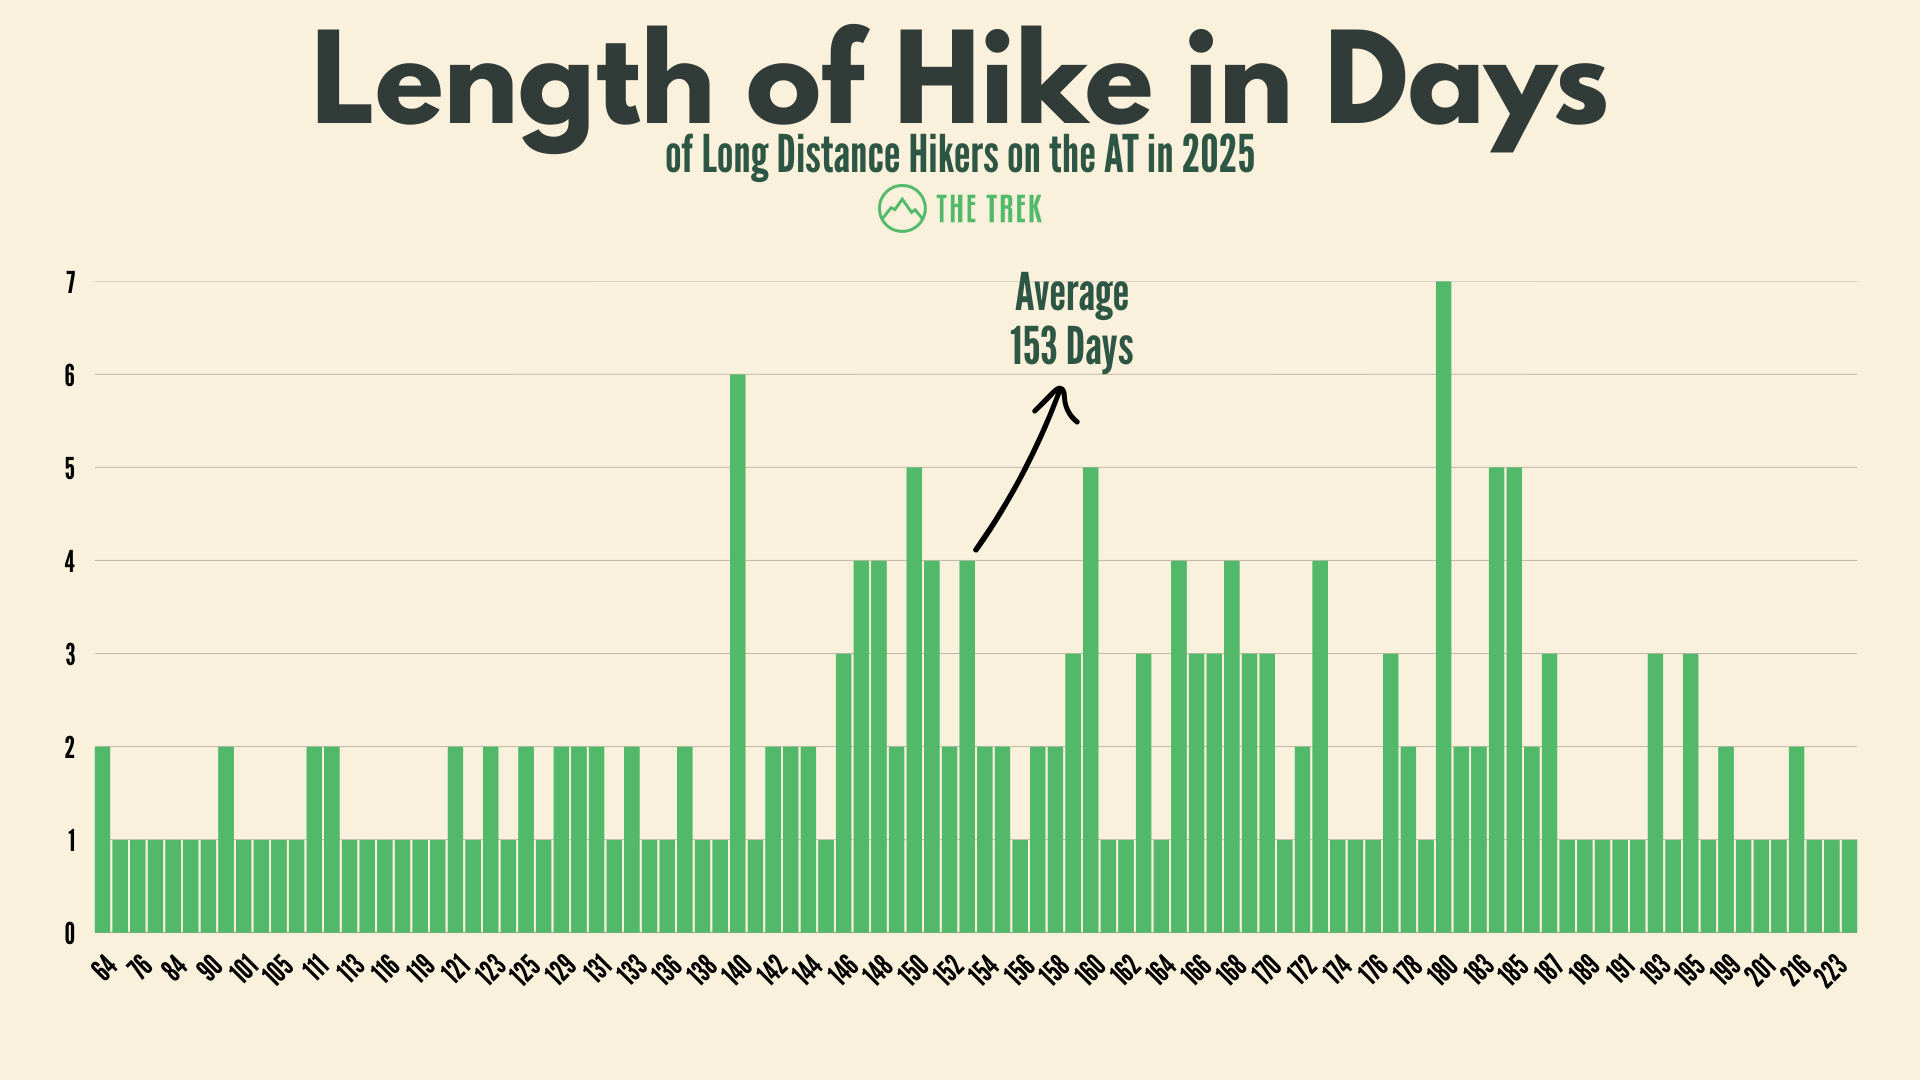
With the information on start and end dates, we can look at the duration of hikers’ treks. We filtered this information to only include respondents who said they completed a thru-hike of the Appalachian Trail.
The average hike this year took 153 days. The longest reported thru-hike was 223 days, and the shortest hikes were two respondents claiming a 64-day thru-hike.
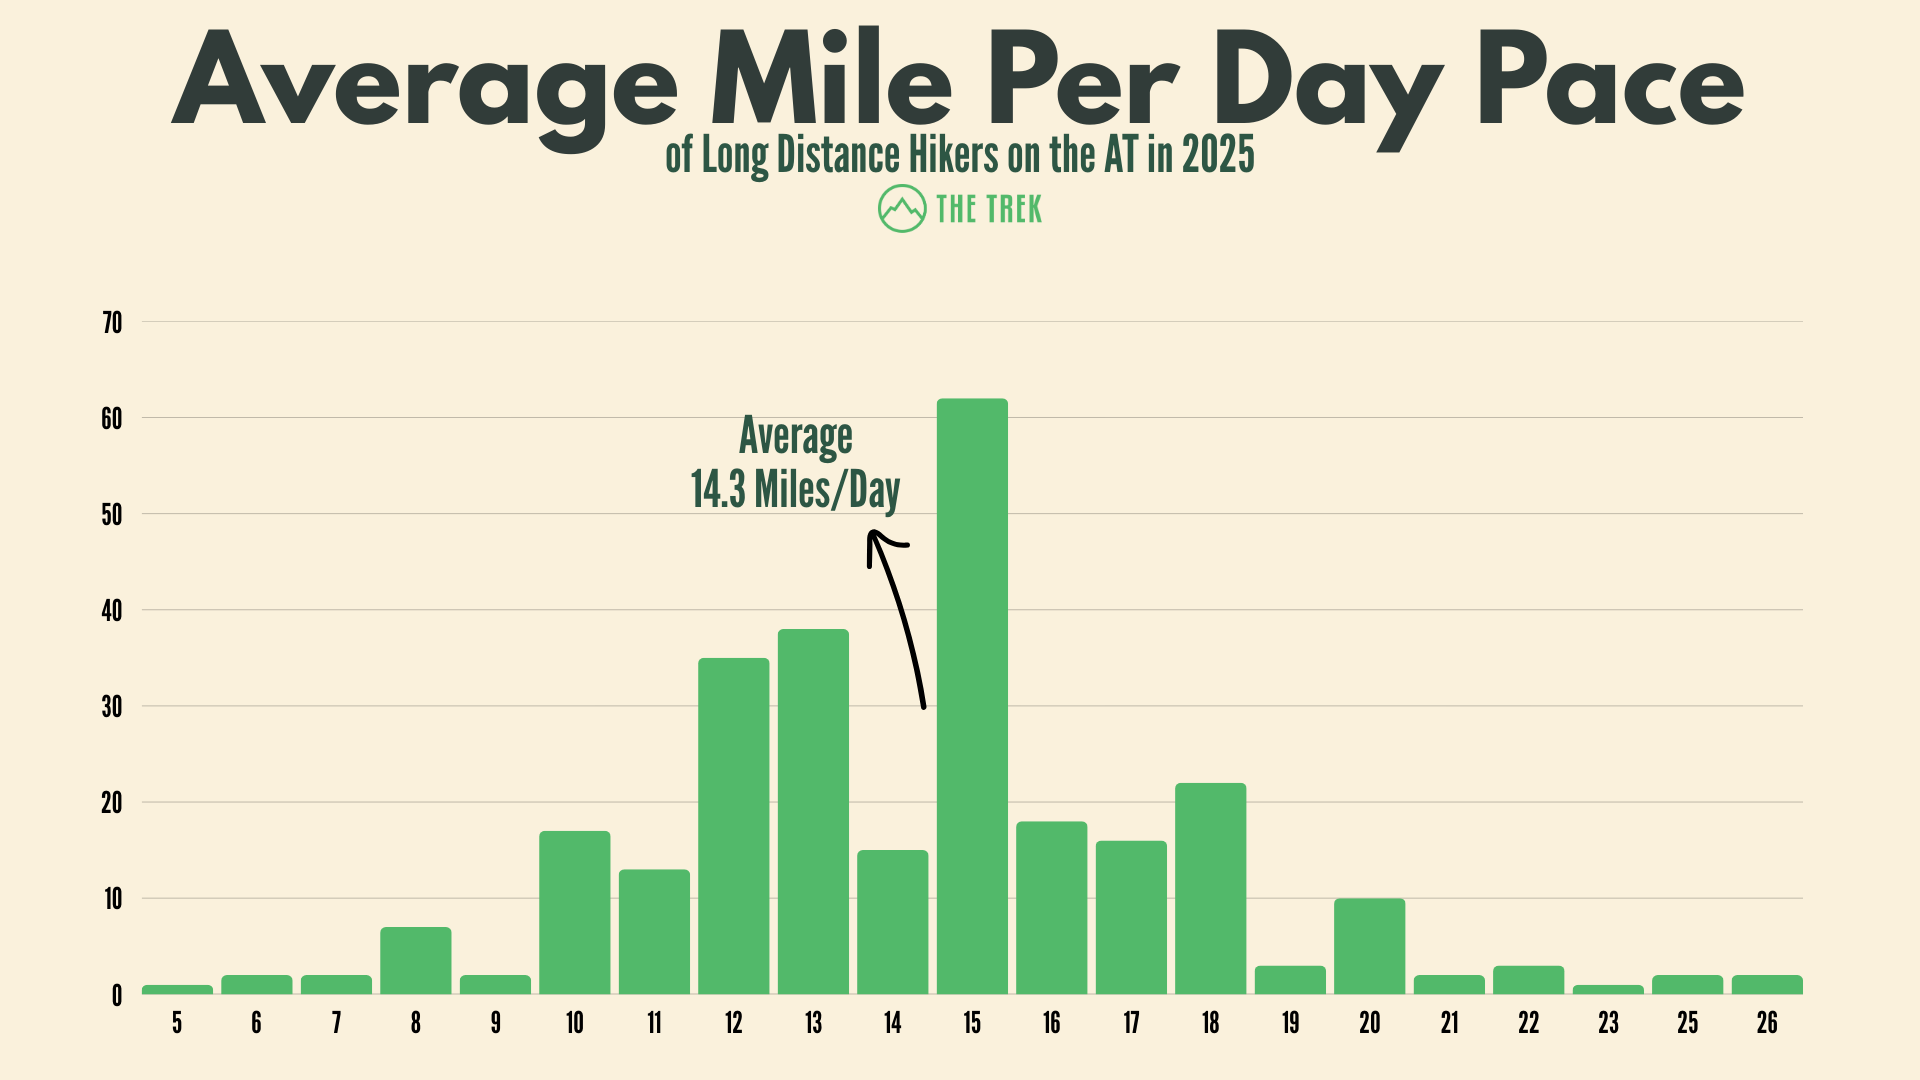
We also asked self-reported thru-hikers about their average daily mileage, with the overall average across respondents coming in at 14.3 miles per day. The single most-reported daily mileage was 15 per day.
This number likely does not account for zero days, and it’s also unlikely that many hikers tracked their exact average mileage with precision; treat this more as a loose guess. For example, someone actually averaging 5 miles per day over the entire trail would take over 400 days to complete it.
ATC Check-Ins and Trail Festivals
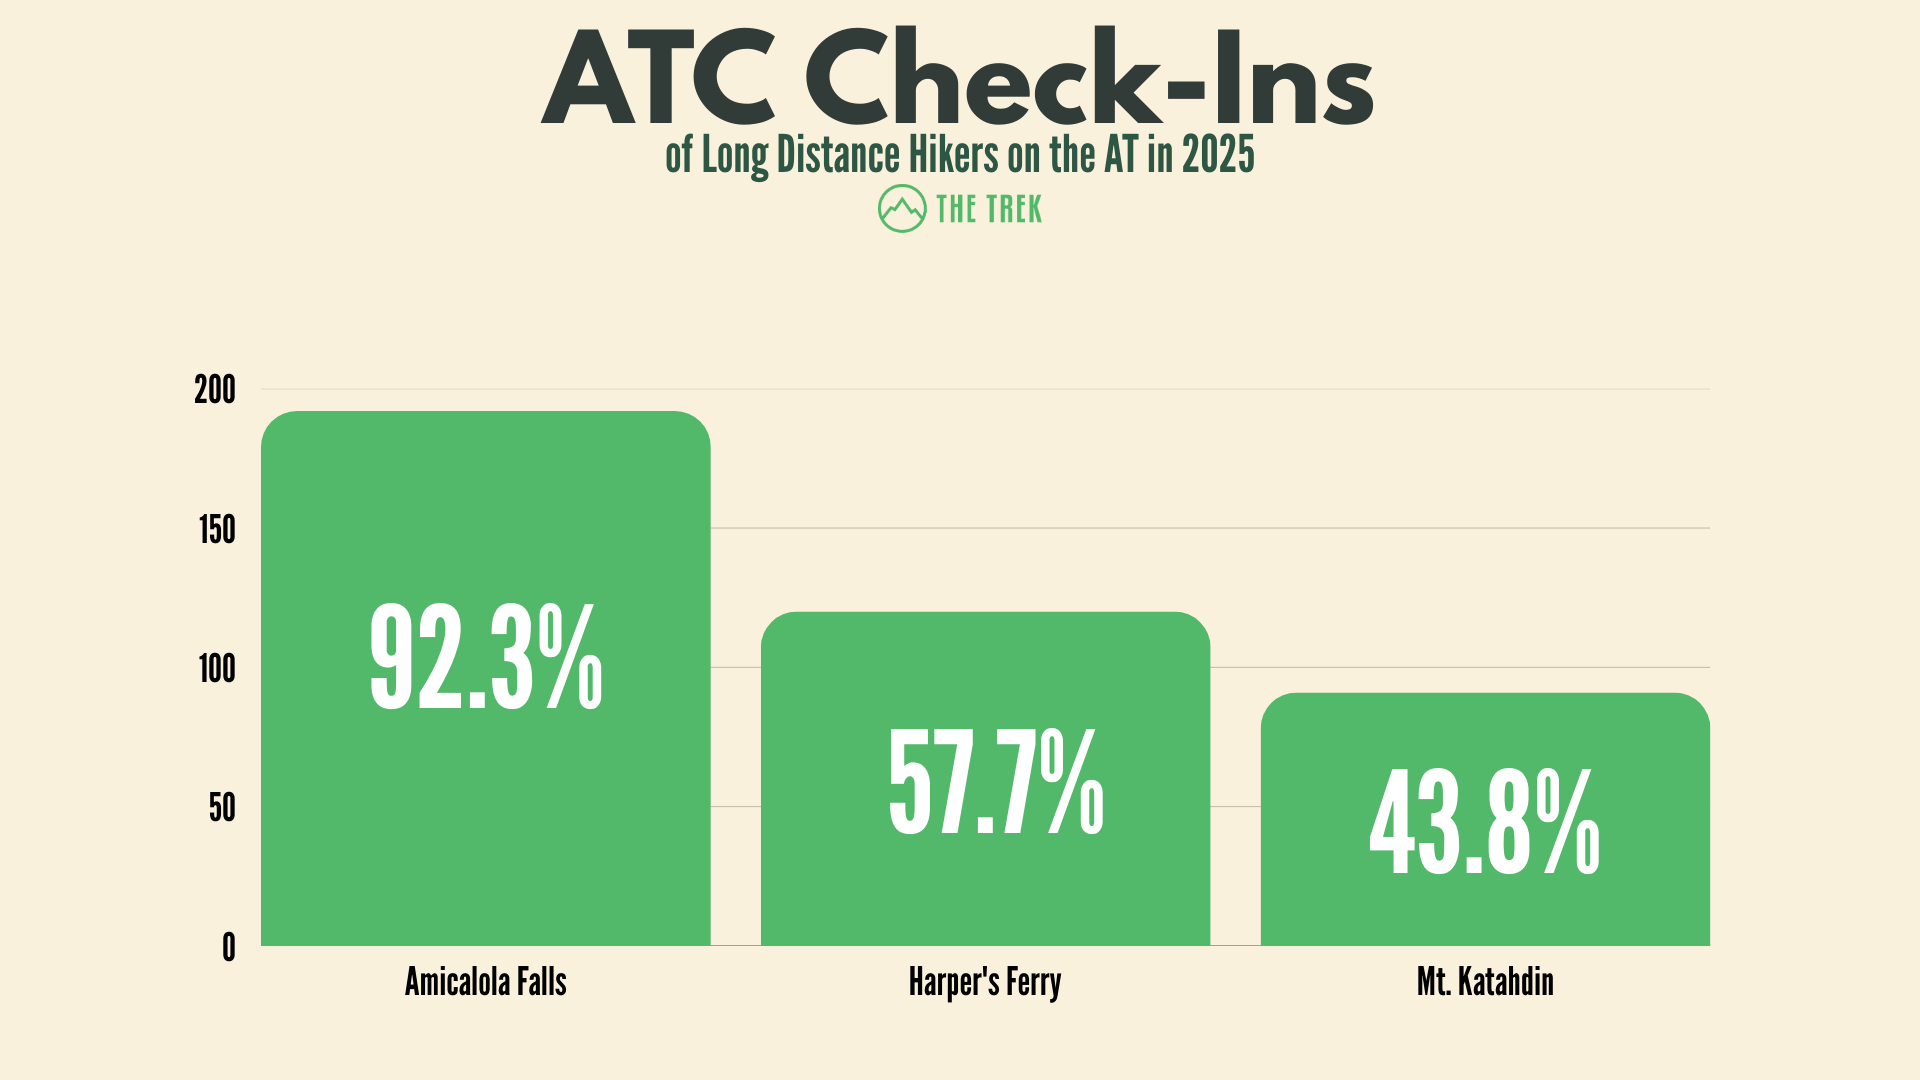
The number of respondents who checked in at the Appalachian Trail Conservancy visitor center at Amicalola Falls State Park, Georgia rose by 10% this year, even as fewer participants hiked northbound and overall survey participation dropped (mirroring an overall drop in thru-hiker numbers in 2025).
The percentage of survey respondents checking in at the Harpers Ferry midpoint visitor center and at the northern end of the trail at Katahdin were also slightly higher than in 2024.
Unrelated to our survey, numbers from the ATC suggest far fewer hikers on the Appalachian Trail in 2025 compared to 2024. This could be due to many factors: economic uncertainty, fears surrounding post-Hurricane Helene recovery, the end of the post-COVID outdoor recreation spike, or simply an unrelated blip in the numbers.
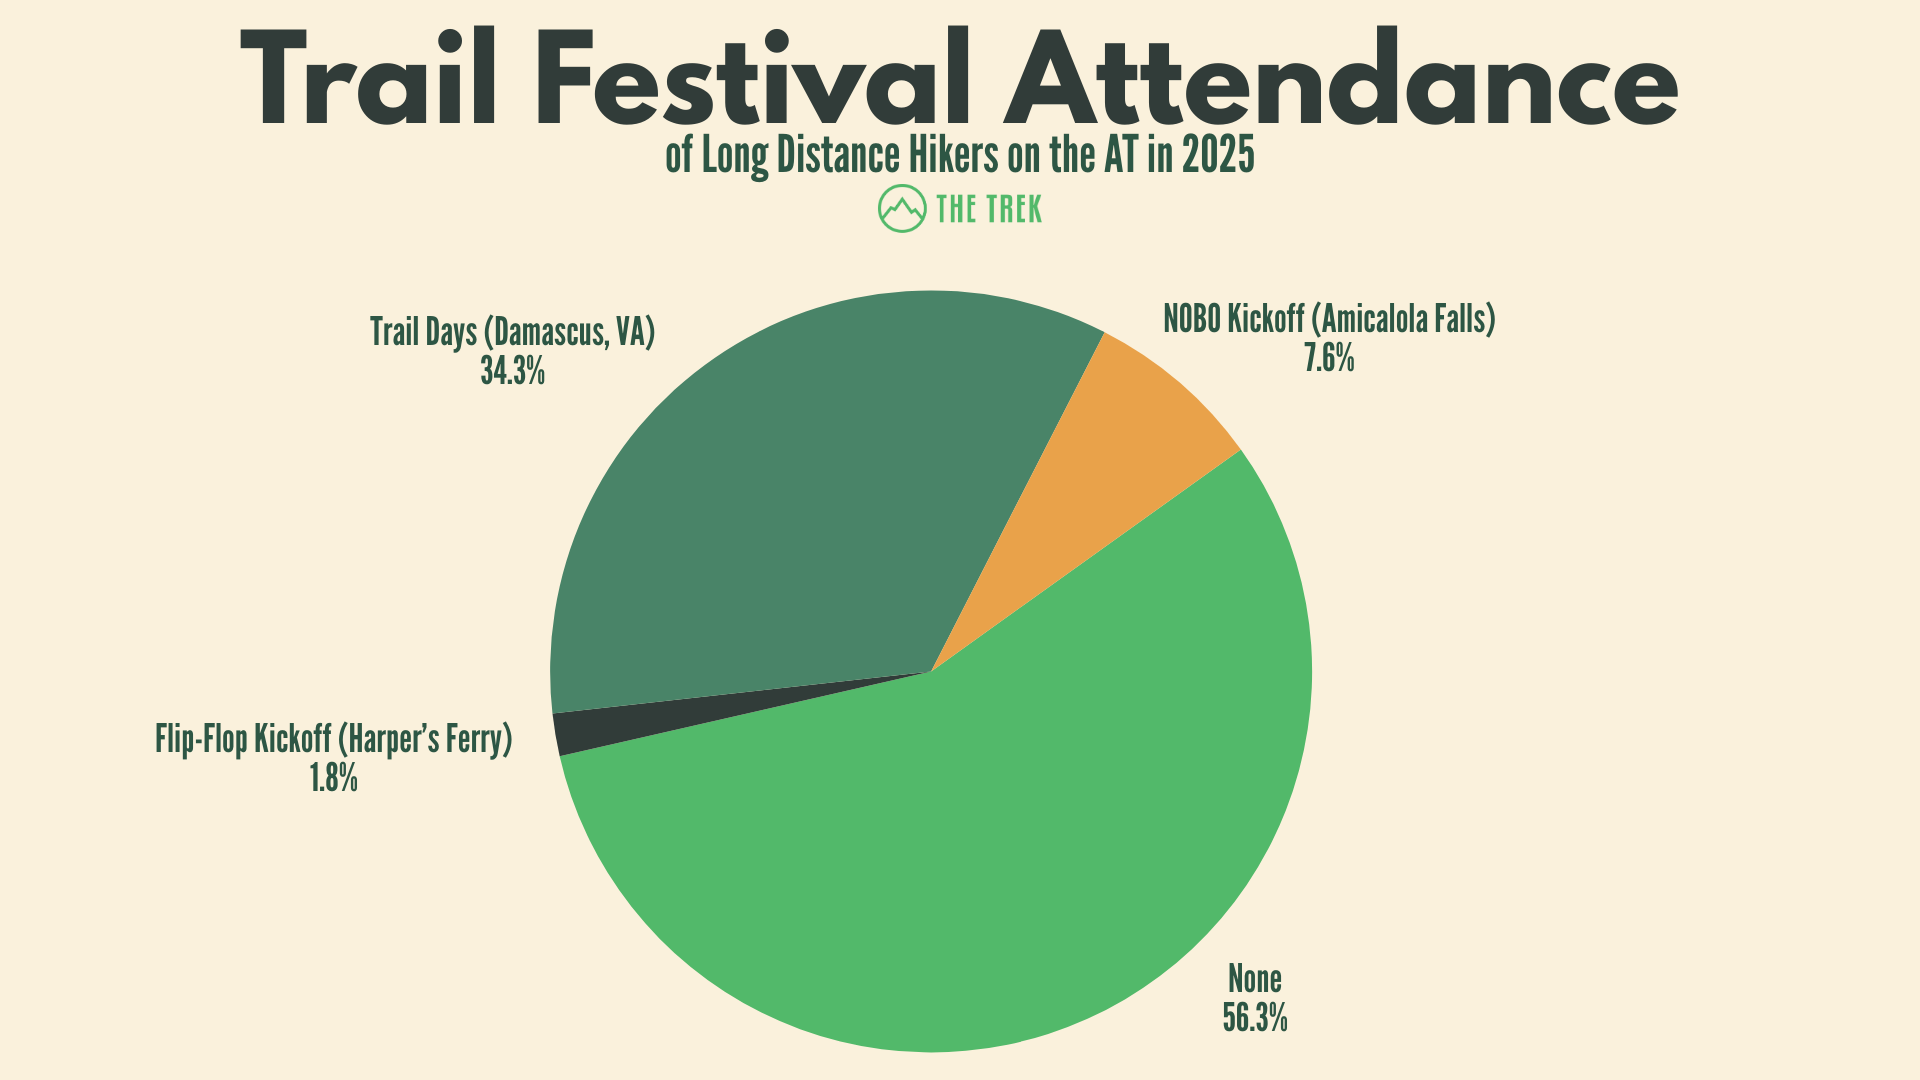
With the rise in the number of ATC check-ins also came a slight fall in the attendance at trail festivals. Around 3% more hikers reported not attending a trail festival as compared to 2024, and both the Flip-Flop Kickoff in Harpers Ferry and the Northbound Kickoff at Amicalola Falls saw around a 2% decrease in attendance.
Trail Days in Damascus, Virginia remains by far the most popular AT festival and, by comparison to the others, saw a slight 1% bump in attendance among our respondents compared to the previous year.
How Much Money Did Thru-Hikers Spend on the AT in 2025?
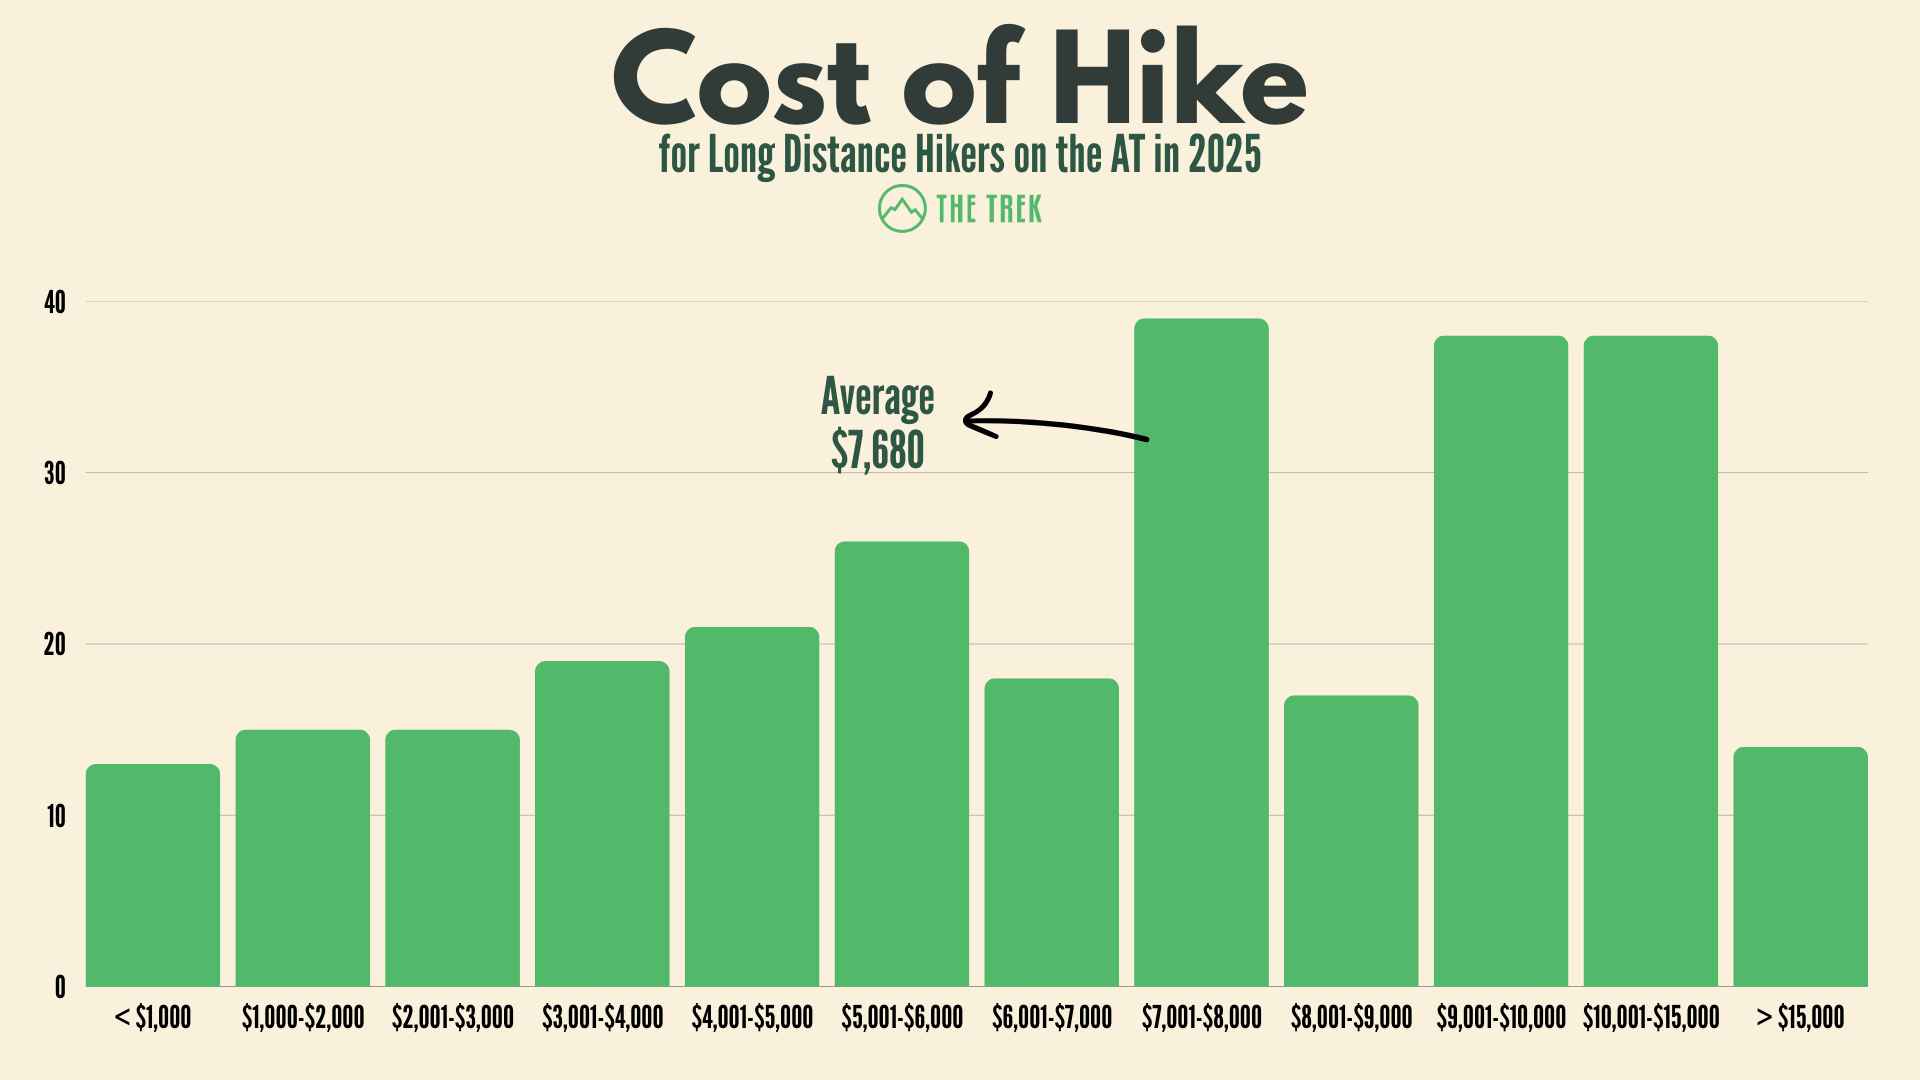
The average cost of an Appalachian Trail thru-hike stayed constant this year ($7,680 compared to 2024’s $7,602), with many hikers also reporting costs over $9,000.
The spread of hikers across this cost spectrum is fairly consistent, but with sharp spikes in the $7,00-to-$8,000, $9,000-to-$10,000, and $10,000-to-$15,000 buckets.
Coming in at the extreme ends, around 13 hikers reported spending under $1,000, and a similar number reported spending over $15,000.
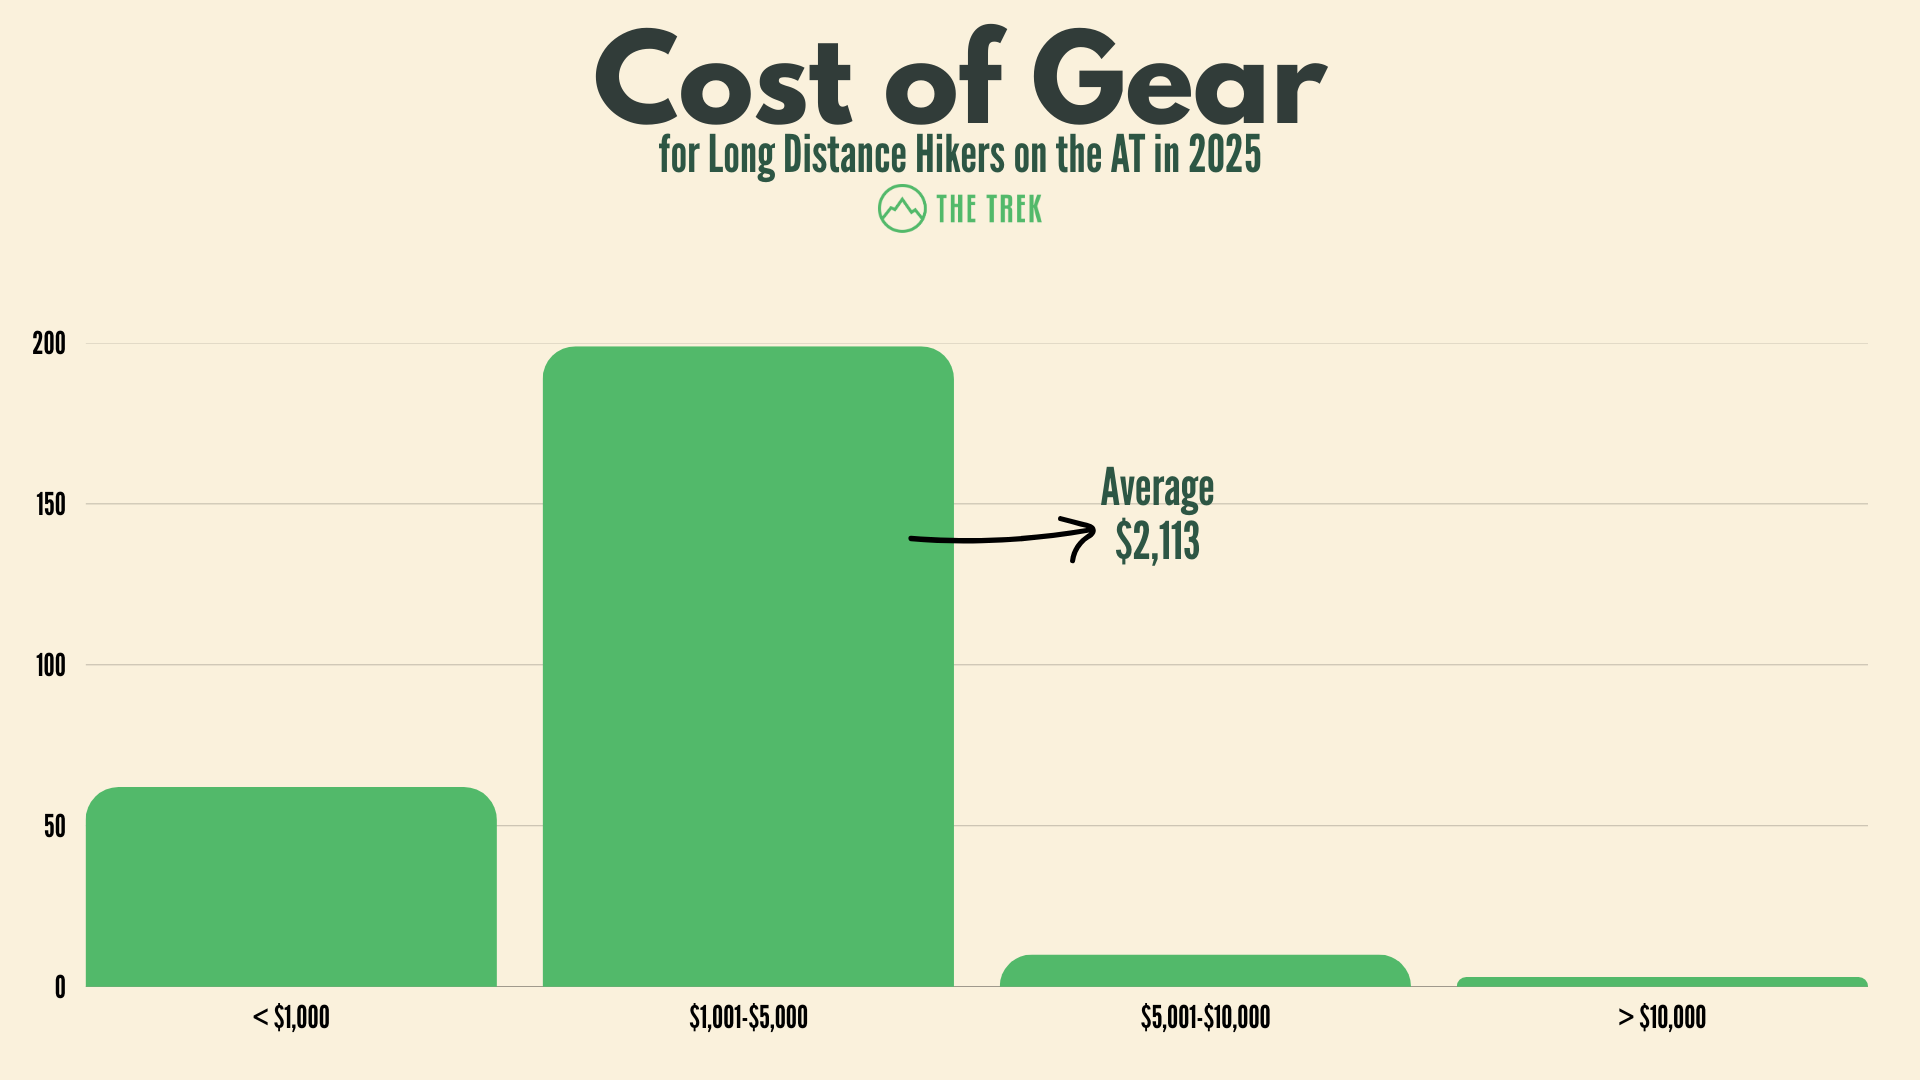
Hikers spent an average of $2,113 on their gear, which is nearly identical to the number reported in 2024. The vast majority of hikers spent under $5,000 on their gear, including the initial cost of purchasing gear along with the ongoing costs of replacing or repairing shoes, clothes, and other items throughout the course of their hike.
One respondent reported spending over $10,000 on their gear for the hike. To that one person, shoot me a message. I’d love to know what you’re carrying with you.
Want to be notified when the 2026 AT Thru-Hiker Survey goes live? Sign up here.
Conclusion
We’re stopping here for now, but there is plenty more data to come. In the next few posts, we will break down everything from hiker experience levels and safety concerns to the nitty-gritty gear stats on shelters, footwear, and backpacks.
If you have any feedback, let us know in the comments! You can also subscribe to the newsletter to get the next posts sent straight to your inbox. A huge shout-out to the hikers of 2025 and everyone who took the time to fill out this survey — we couldn’t do it without you.
Featured image: Graphic design by Chris Helm.

This website contains affiliate links, which means The Trek may receive a percentage of any product or service you purchase using the links in the articles or advertisements. The buyer pays the same price as they would otherwise, and your purchase helps to support The Trek's ongoing goal to serve you quality backpacking advice and information. Thanks for your support!
To learn more, please visit the About This Site page.

Comments 4
I have a question about the survey on the question about prior backpacking experience. When its stated “The average hiker on the Appalachian Trail in 2025 had between one and seven nights of prior backpacking experience” does that mean consecutive backpacking experience? For example, if I go on 6 weekend trips a year and each one is a 2 night / 3 day trip, does this mean I have 12 nights of experience or does that mean I only have 2 nights experience? Thanks!
I have a question about the survey on the question about prior backpacking experience. When its stated “The average hiker on the Appalachian Trail in 2025 had between one and seven nights of prior backpacking experience” does that mean consecutive backpacking experience? For example, if I go on 6 weekend trips a year and each one is a 2 night / 3 day trip, does this mean I have 12 nights of experience or does that mean I only have 2 nights experience? Thank you!
I don’t see how to send a personal message so you can delete this after you read it.
Regarding the ‘Home States’ picture. The abbreviation for Georgia is GA, not GE.
Otherwise an interesting read.
Hi, I noticed that thetrek.co is focused on maximizing lead intake in the autorepair sector. One of our clients recently identified $1.15M in annual revenue leakage due to missed after- hours leads. We respond to inquiries in under 10 seconds, capturing those silent leads that often slip through the cracks.
Do you or your Sales Manager have 15 minutes for a ‘Revenue Sprint’ to see the specific leakage data for your company?
Best,
Russell