 ">
">
The 2022 AT Thru-Hiker Survey: General Information
Welcome to the first post for the 2022 Thru-Hiker Survey! This year we added questions about power banks and hammock underquilts. We also removed questions about COVID that weren’t as relevant this year.
Each post will focus on a different topic, and we’re starting with general information. This includes hiker demographics, budgets, behaviors, favorite/least favorite sections, and favorite hostels.
Thanks to everyone who participated this year! We collected 403 responses this year, up significantly from previous years. The data was collected from October through November of 2022 via our social media platforms, Backpacker Radio, and TheTrek.co. Some clean-up of the data was done only when necessary, mostly involving start/end dates. (There were a few time travelers who claimed to have started their hike in 2023 while still completing it this year.) No obvious duplicates were found.
Let’s get into it!
READ NEXT –
- The 2021 AT Thru-Hiker Survey: General Information
- The Appalachian Trail Thru-Hiker Survey (All Years)
Demographics
 This year we had 403 respondents to the survey. The average age was 37, the same as last year. However, the median age was 32, and the most common age was tied between 24 and 26. The oldest hiker who completed the survey was 71, and the youngest was 17.
These values show how the wide range of older hikers skews the average age higher. Thru-hikers are often a younger crowd, and the numbers this year agree with that, with almost 50 percent of respondents under the age of 30.
We asked about participants’ biological sex and gender. This year, 56 percent of respondents were biologically male, while 44 percent were biologically female. Meanwhile, 55 percent of respondents identified as men, 42.75 percent identified as women, and 2.25 percent identified as non-binary or other.
More women and other gender identities participated in the survey this year compared to last. The percentage of women increased from 38 to 42.5, and the percentage of those who identified as non-binary or other increased from 1 to 2.25.
READ NEXT – The Appalachian Trail Thru-Hiker Checklist
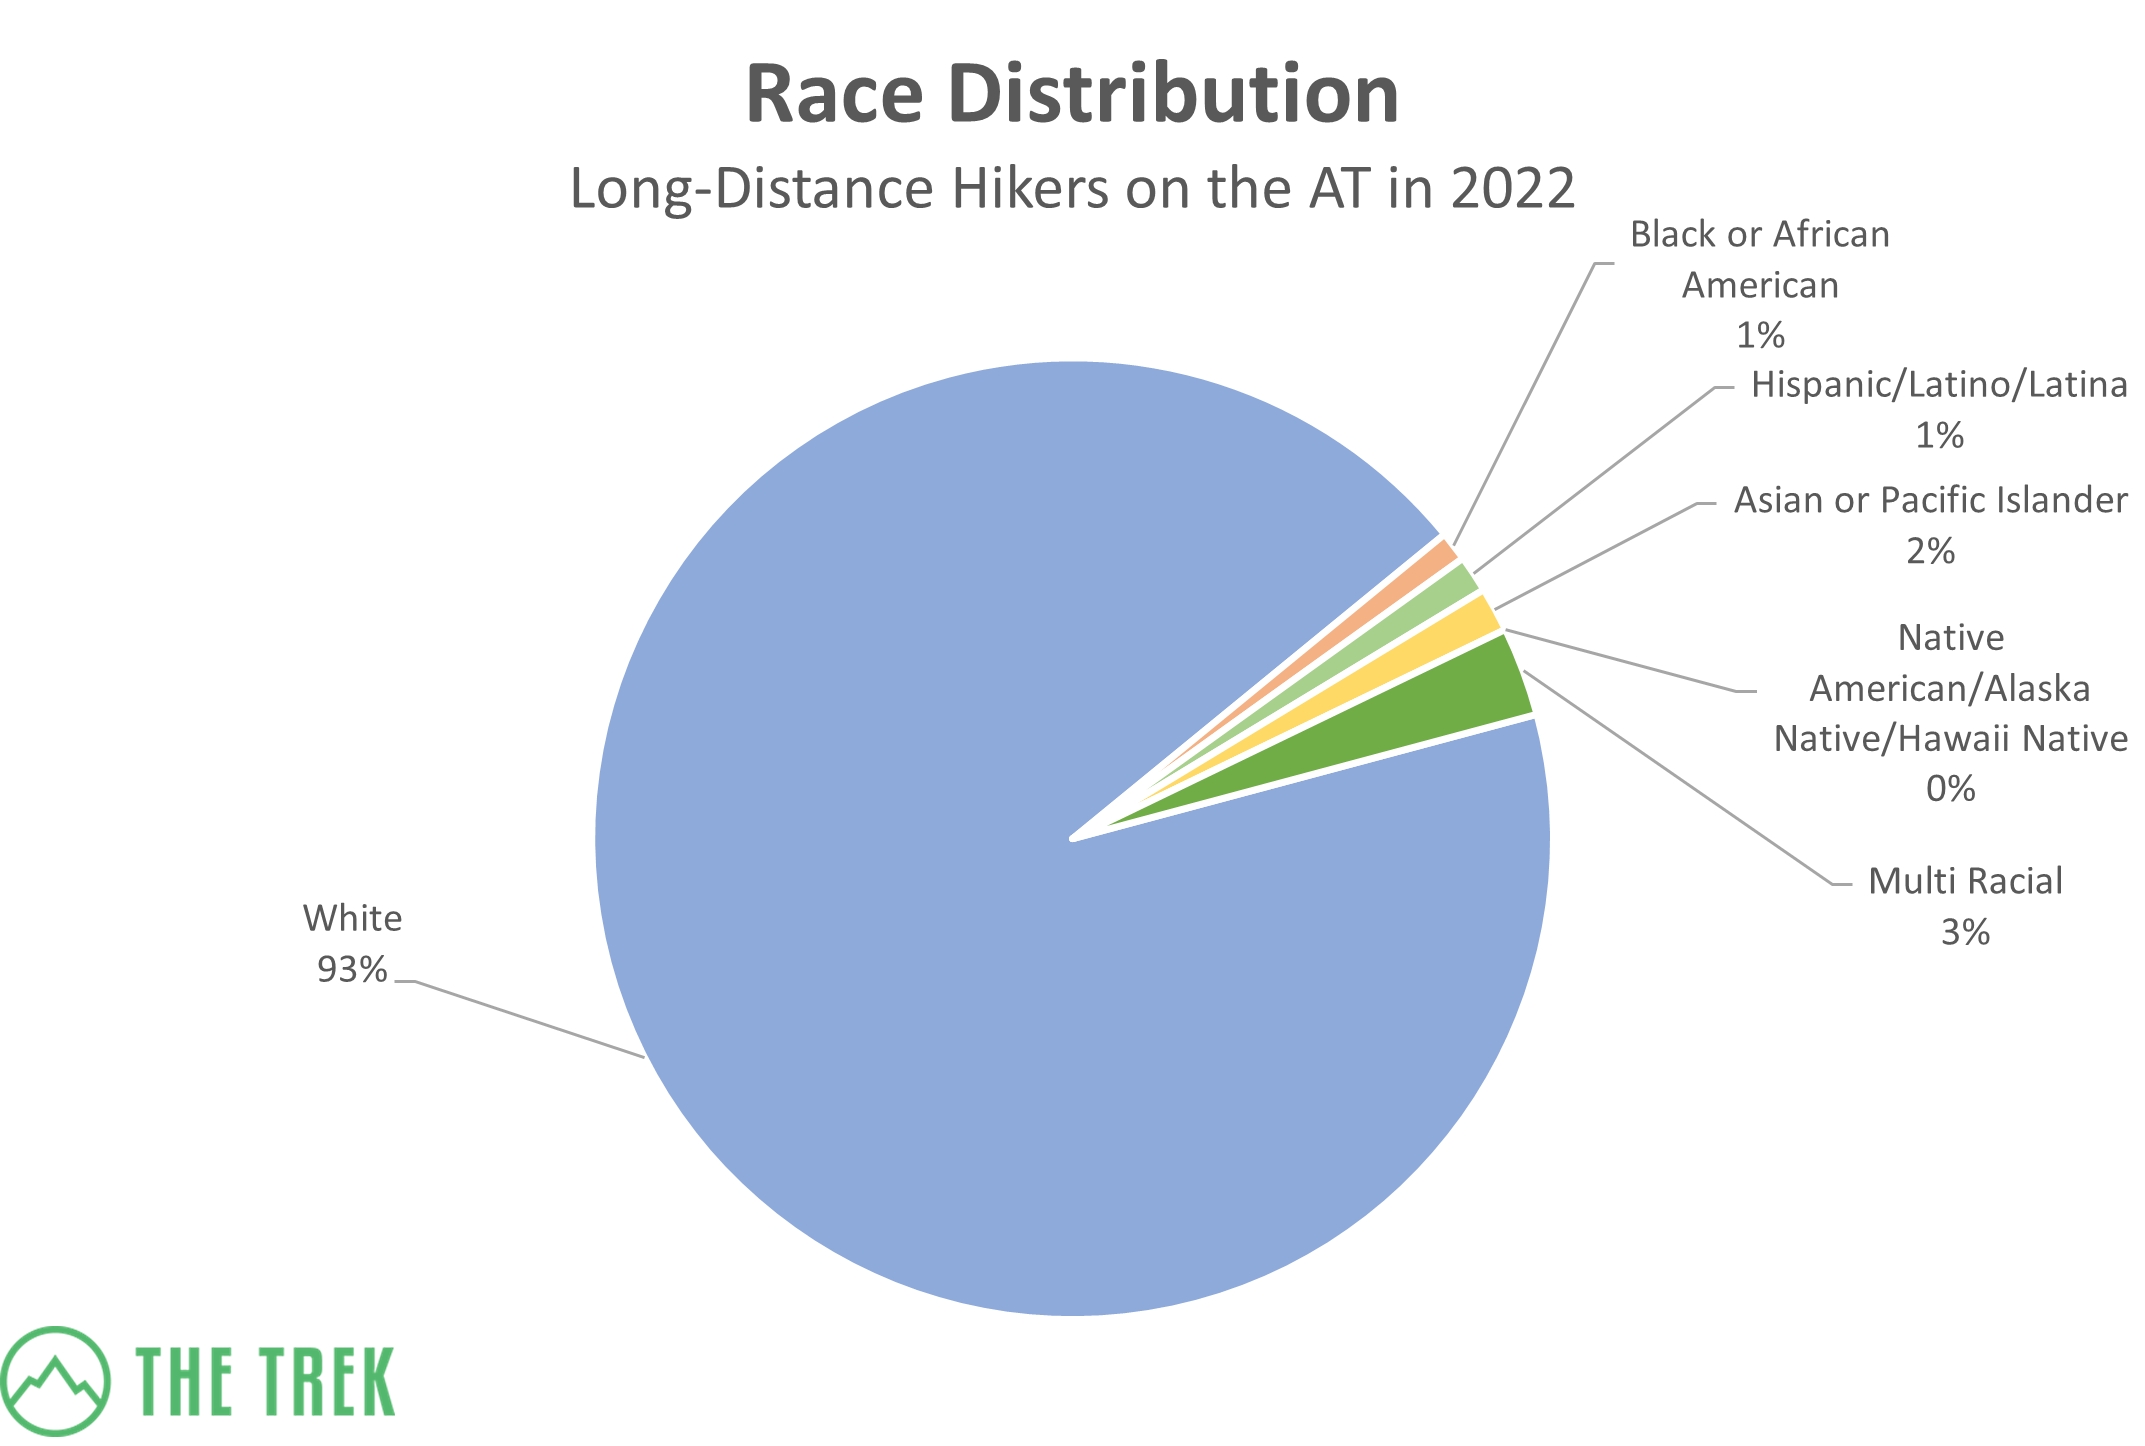
This year 373 (93.3 percent) identified as White, four as Black, five as Hispanic/Latino/Latina, six as Asian or Pacific Islander, and 12 as multi-racial. The statistics compare similarly to previous years in that the vast majority of hikers are White. There was an uptick in Asian hikers this year from one to six.

Over three-quarters of hikers had an Associate’s, Bachelor’s, or professional degree. Only four hikers had not finished high school, but it should be noted one of them was 17 (also our youngest hiker). While most hikers are college educated, it is also notable that 16 percent of hikers this year were 22 or under.
This year, 88 percent of hikers were from the United States. It’s back to around the same percentage as it was in 2019 after dipping dramatically over the past couple of years due to COVID. Of the 47 international hikers, 12 were from Canada, eight were from Germany, and five were from England. Three or fewer hikers hailed from each of the following countries: the Netherlands, Scotland, Australia, Ireland, France, and Colombia.
What States were Hikers in 2022 From
As is typical, most US participants this year came from states on the East Coast, especially those along the AT. Massachusetts, North Carolina, Pennsylvania, Georgia, and Florida had the most hikers, respectively. Five hikers were from Washington DC, but it could not be included in this map.
Hiking Basics
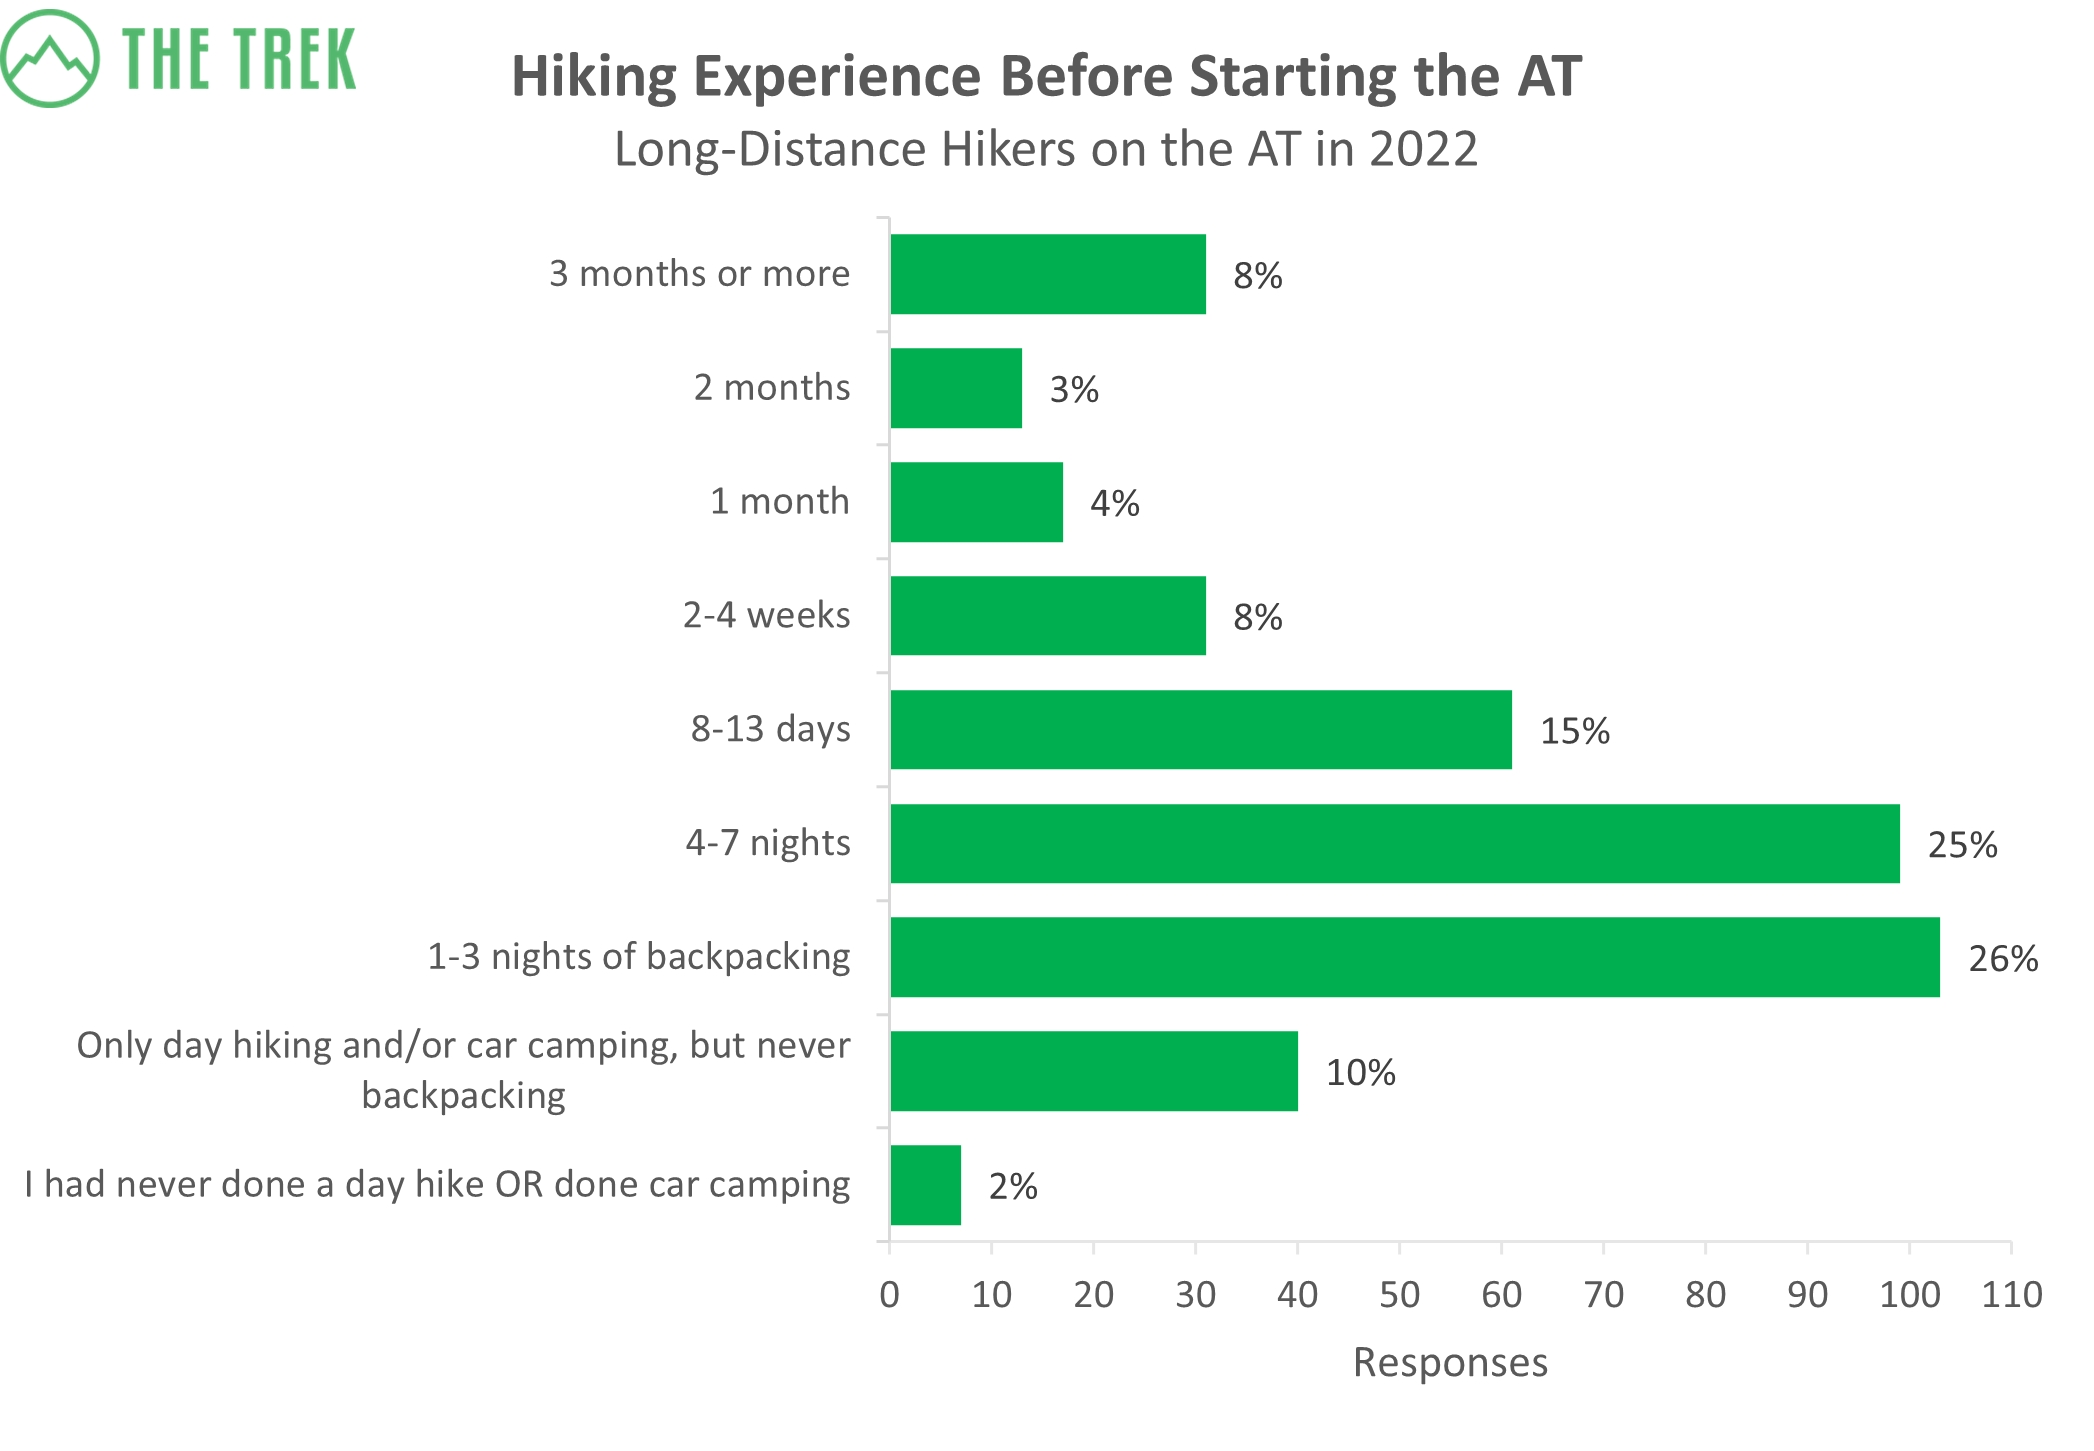 Over 50 percent of hikers had between one and seven nights of prior backpacking experience before the AT. Fifteen percent of hikers had completed over a month of backpacking previously, while only 2 percent had no prior hiking or camping experience whatsoever. Of the seven hikers who had no prior experience, four completed their thru-hikes, and the other three completed at least 1,000 miles of the trail.

As this survey targets thru-hikers, we normally see a high completion percentage as compared to what might be expected or the Appalachian Trail Conservancy (ATC) reports. This year, 332 respondents out of 403, or 83 percent, successfully completed a thru-hike. By comparison, completion rates reported by the ATC from 2012 to 2018 (the last year for which rates have been tabulated) range from 19 to 30 percent for northbound and southbound thru-hikers.
READ NEXT – Why 75% of AT Thru-Hikers Won’t Make It (Spoiler: It’s Complicated)

Forty-six participants did not finish a thru-hike this year, but 10 of them only intended to hike a section. The most common reason for not completing a thru-hike was injury, with 15 hikers—one-third of non-finishers—stating that as their reason for not finishing. The most commonly mentioned “other” reason was running out of time.
Timeline
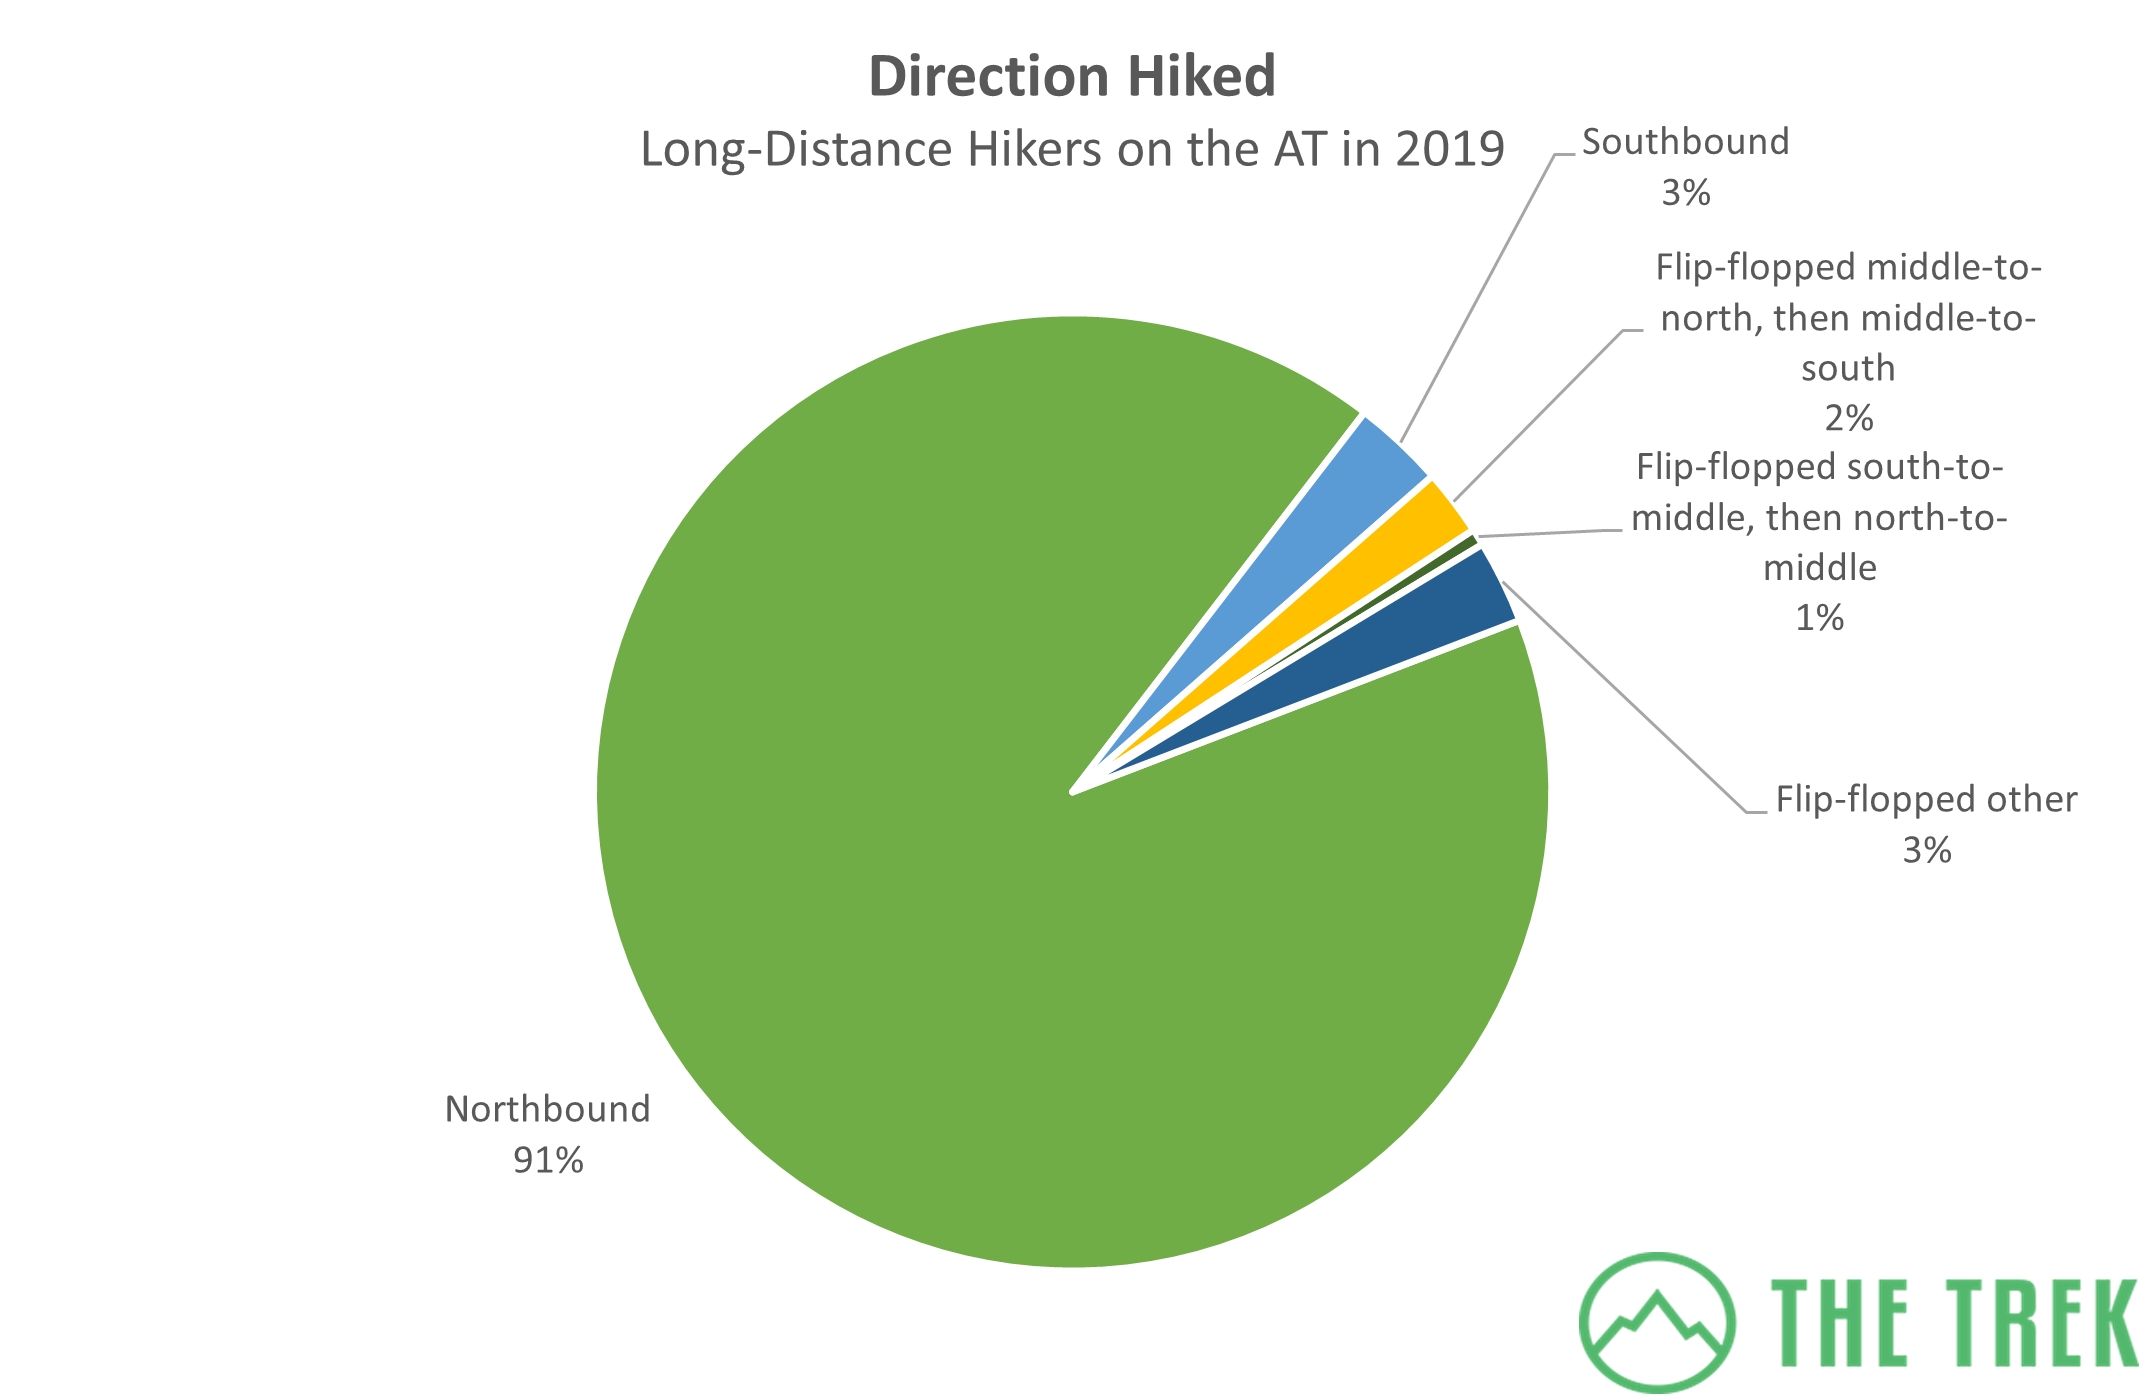 Unsurprisingly, northbound hikes remain by far the most popular itinerary. Most participants this year (91 percent) walked northbound from Georgia to Maine. The number of participants who flip-flopped this year decreased quite a bit. Flip-flopping was more popular than usual during COVID, so this year’s decrease could be related to restrictions lessening. However, the numbers are still down from 2019, when 11 percent of all survey respondents flip-flopped. Only 6 percent of hikers flip-flopped in any direction this year.
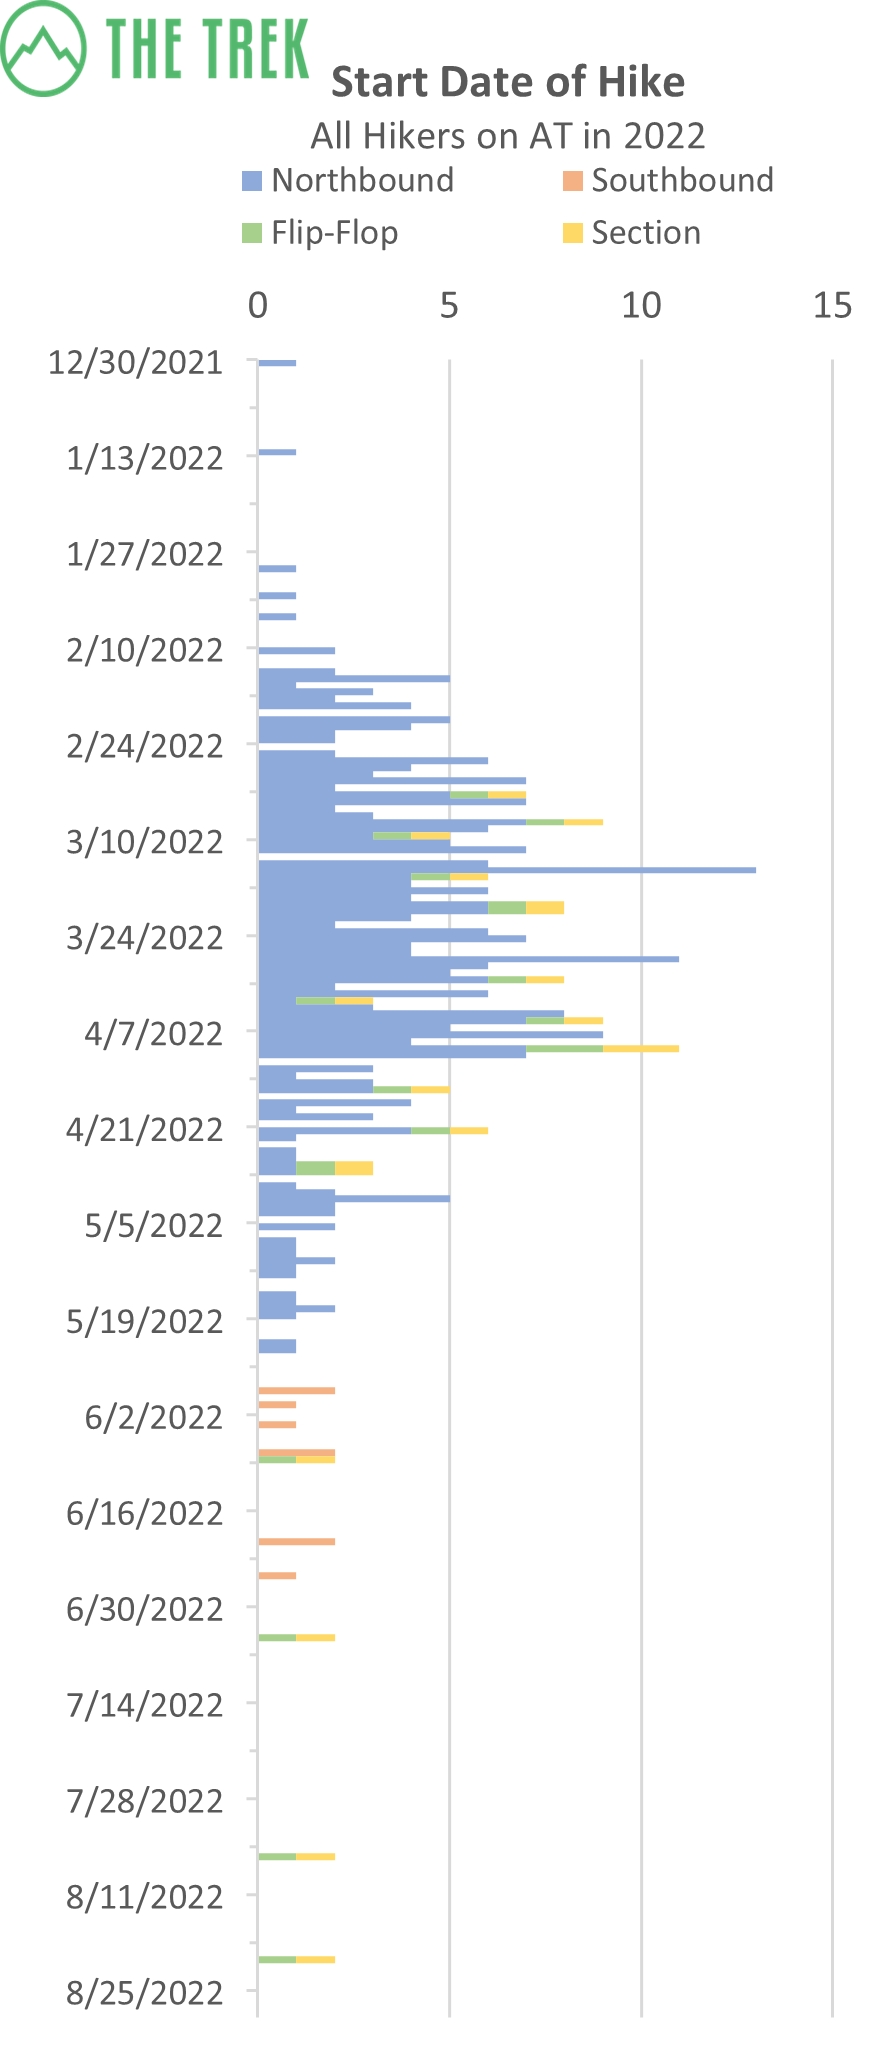
The majority of participants began their hikes in March and early April. The most popular day was March 14 this year, a couple weeks earlier than in previous years. Two participants (one flip-flopper and one section hiker) started before December 30, 2021, and one flip-flopper began on October 9, 2022—these outliers were not included in the chart above. The latest southbound hiker started August 25, though most began in June.
READ NEXT –
- Why February Is the Best Month To Start the Appalachian Trail
- The Best Time of Year To Start These 23 Popular Long Trails
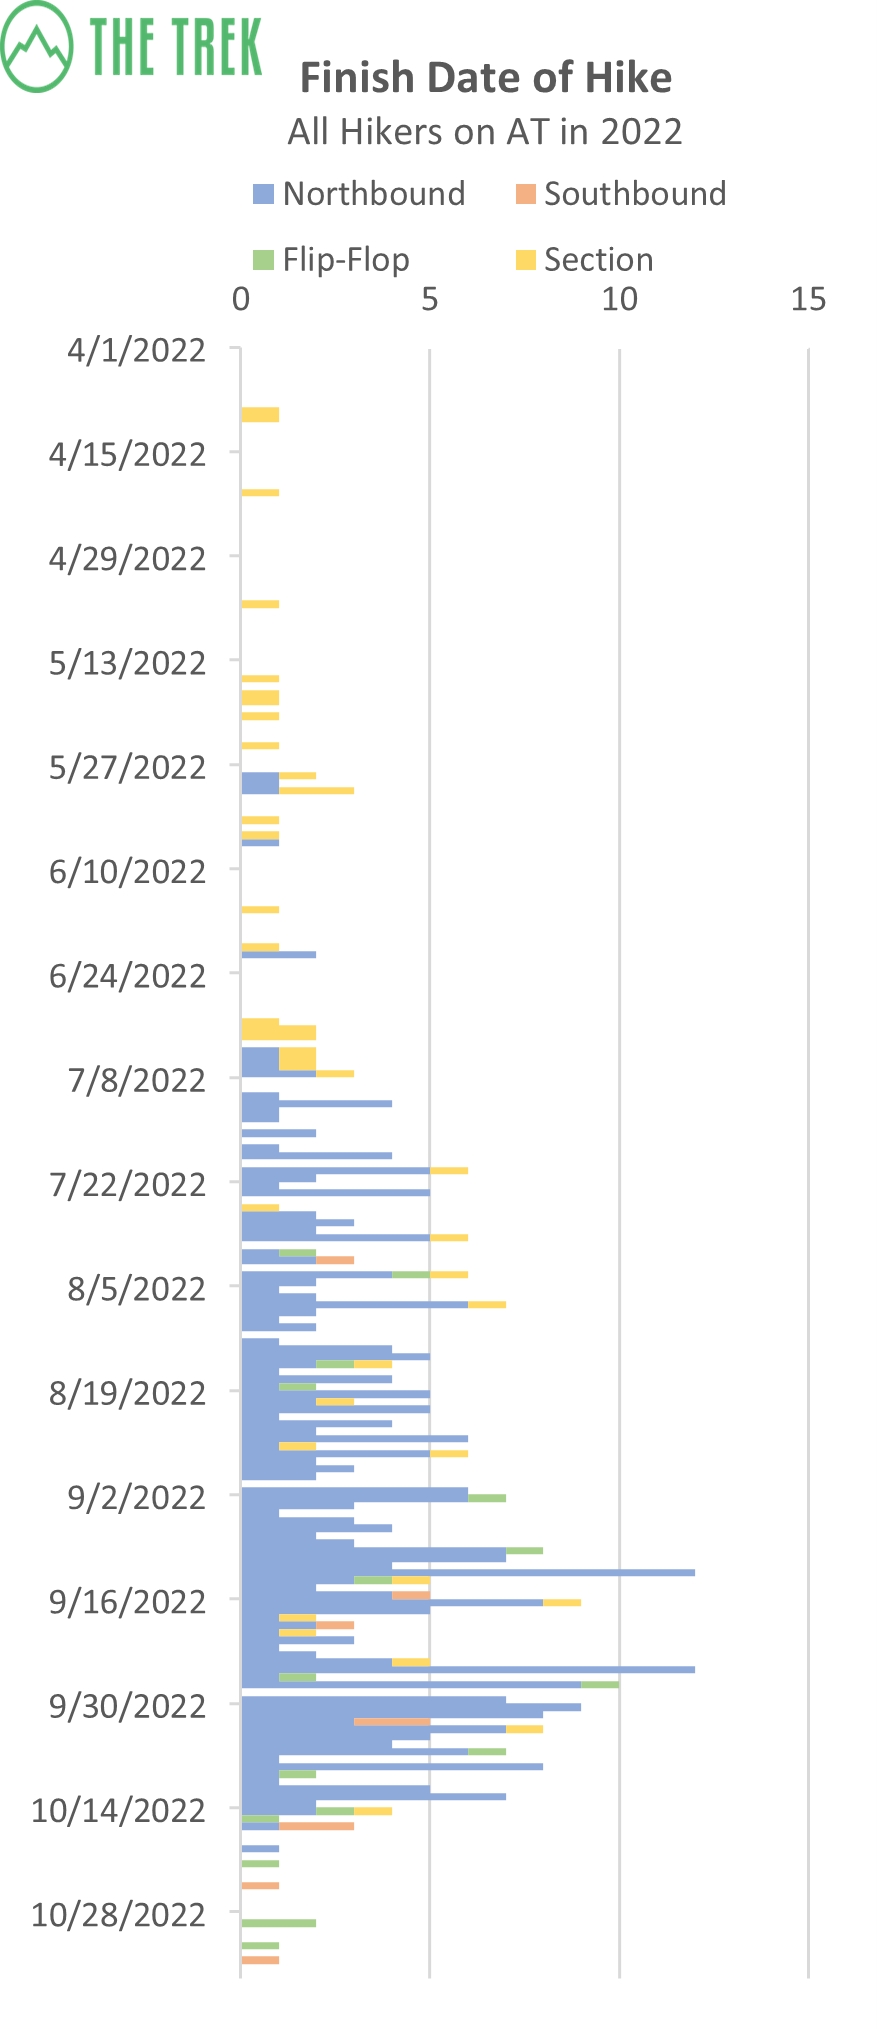
The earliest reported finish date was April 9, 2022. However, this was reported by a section hiker, as were many of the other early finishers. Our first northbound thru-hiker finished on May 29, 2022 (with a start date of December 30, 2021). Most hikers finished their northbound thru-hikes in September and early October. Some hikers were still completing the hike when they filled out the survey.
Pace
The average pace for thru-hikers was 13.7 miles per day, with a median of 13.2 miles per day (calculated from start and end dates). The slowest averaged 7.5 miles per day, while the fastest averaged 32.8 miles per day.
For section hikers, the average pace was 10.4 miles per day, with a median of 10 miles per day. The fastest section hiker averaged 32.3 miles per day, while the slowest averaged 1.6 miles per day.

Sixty-two percent of participants slept in town on most town days. Very few hikers said they never slept in town, even on resupply days.
Festivals and Check-Ins

This year 84 percent of hikers checked in with the ATC, a jump up from last year’s 65 percent. The check-in percentages at Harpers Ferry and Katahdin were about the same as in previous years.
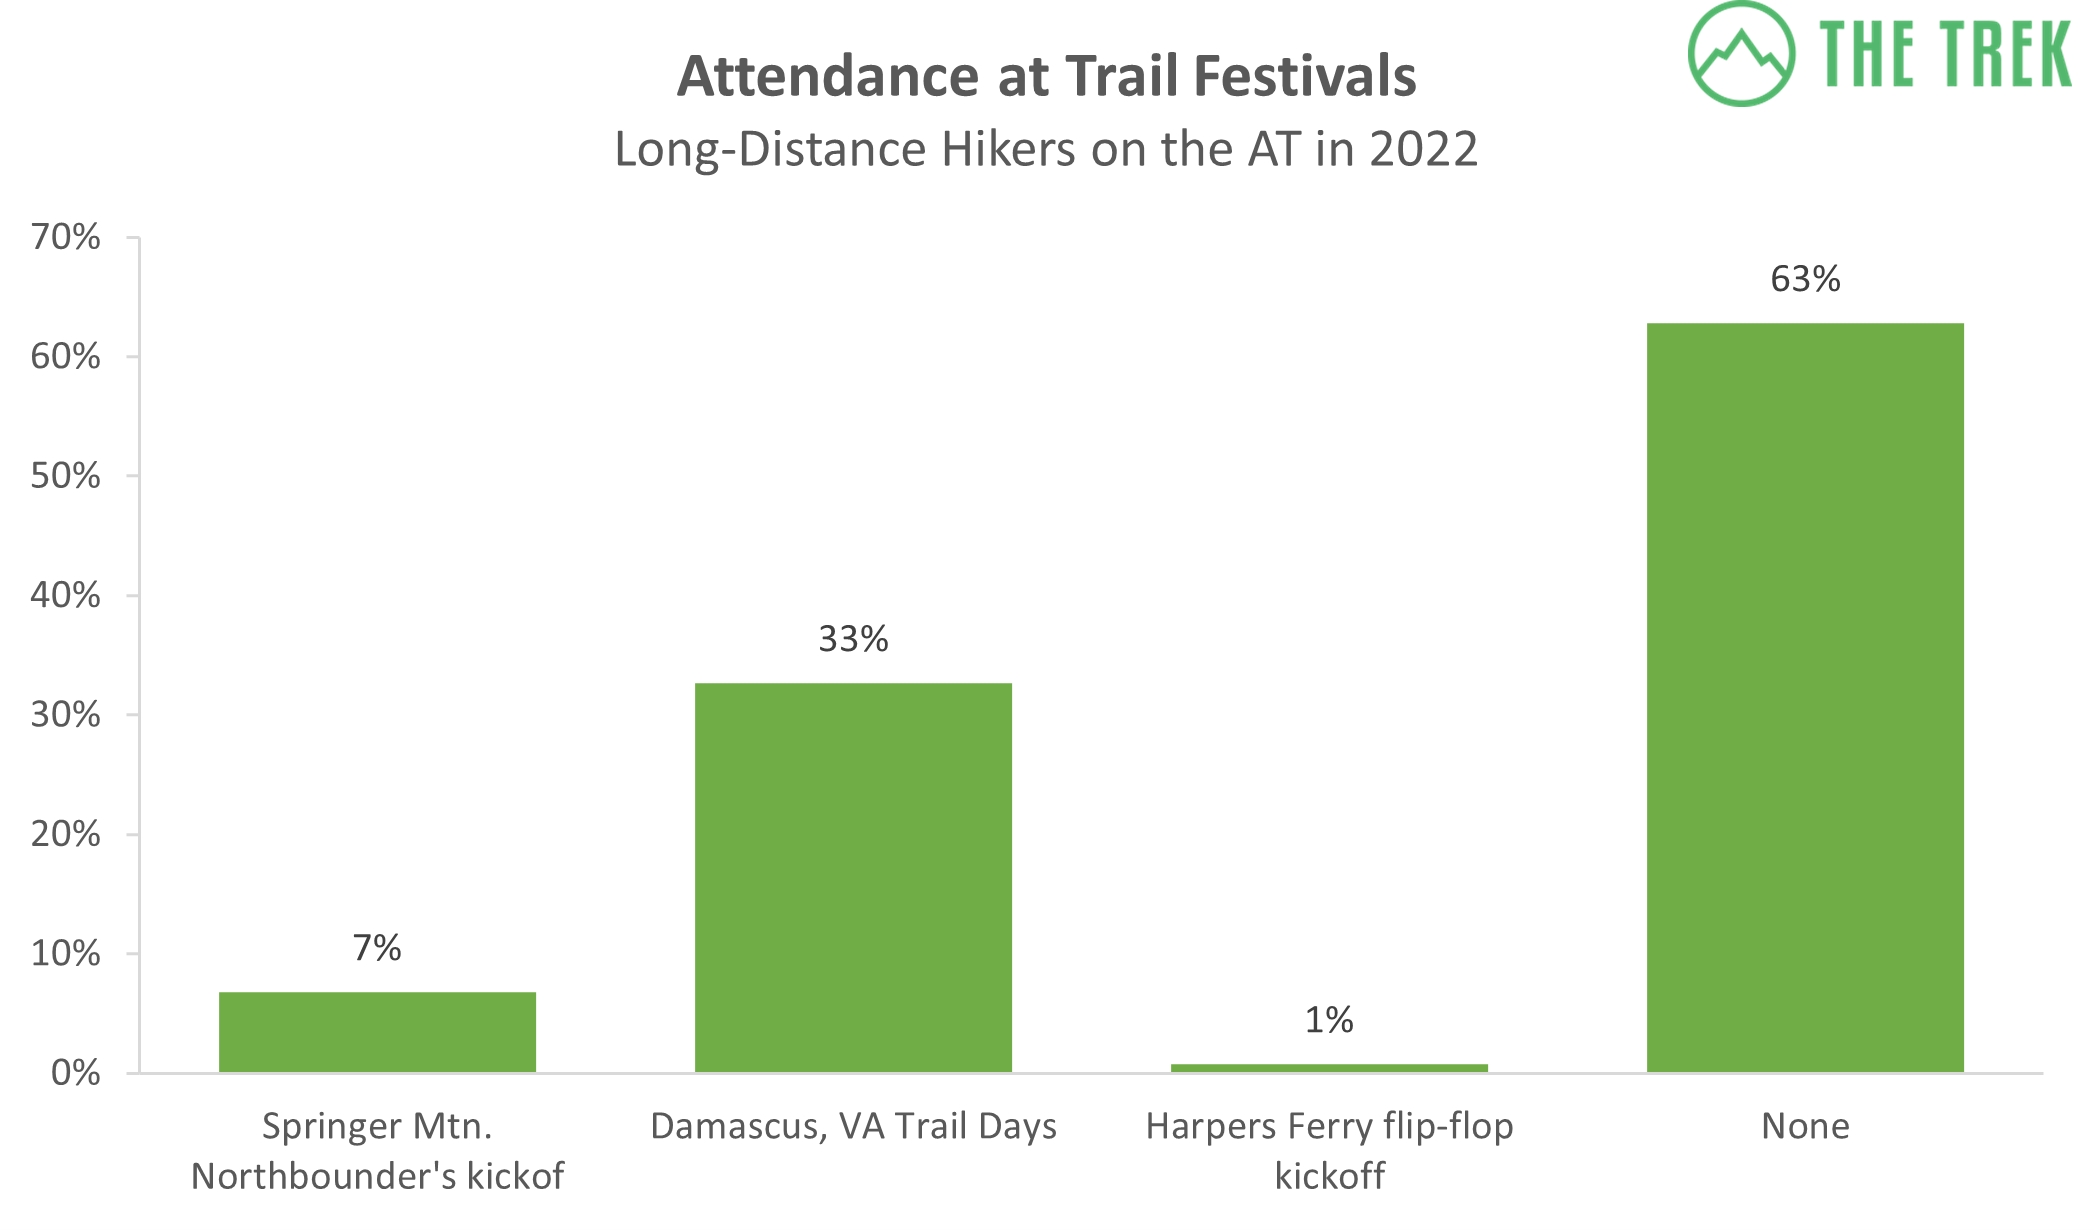 Festival attendance was down from last year: only 33 percent of hikers attended Trail Days compared to 40 percent last year.
Companionship
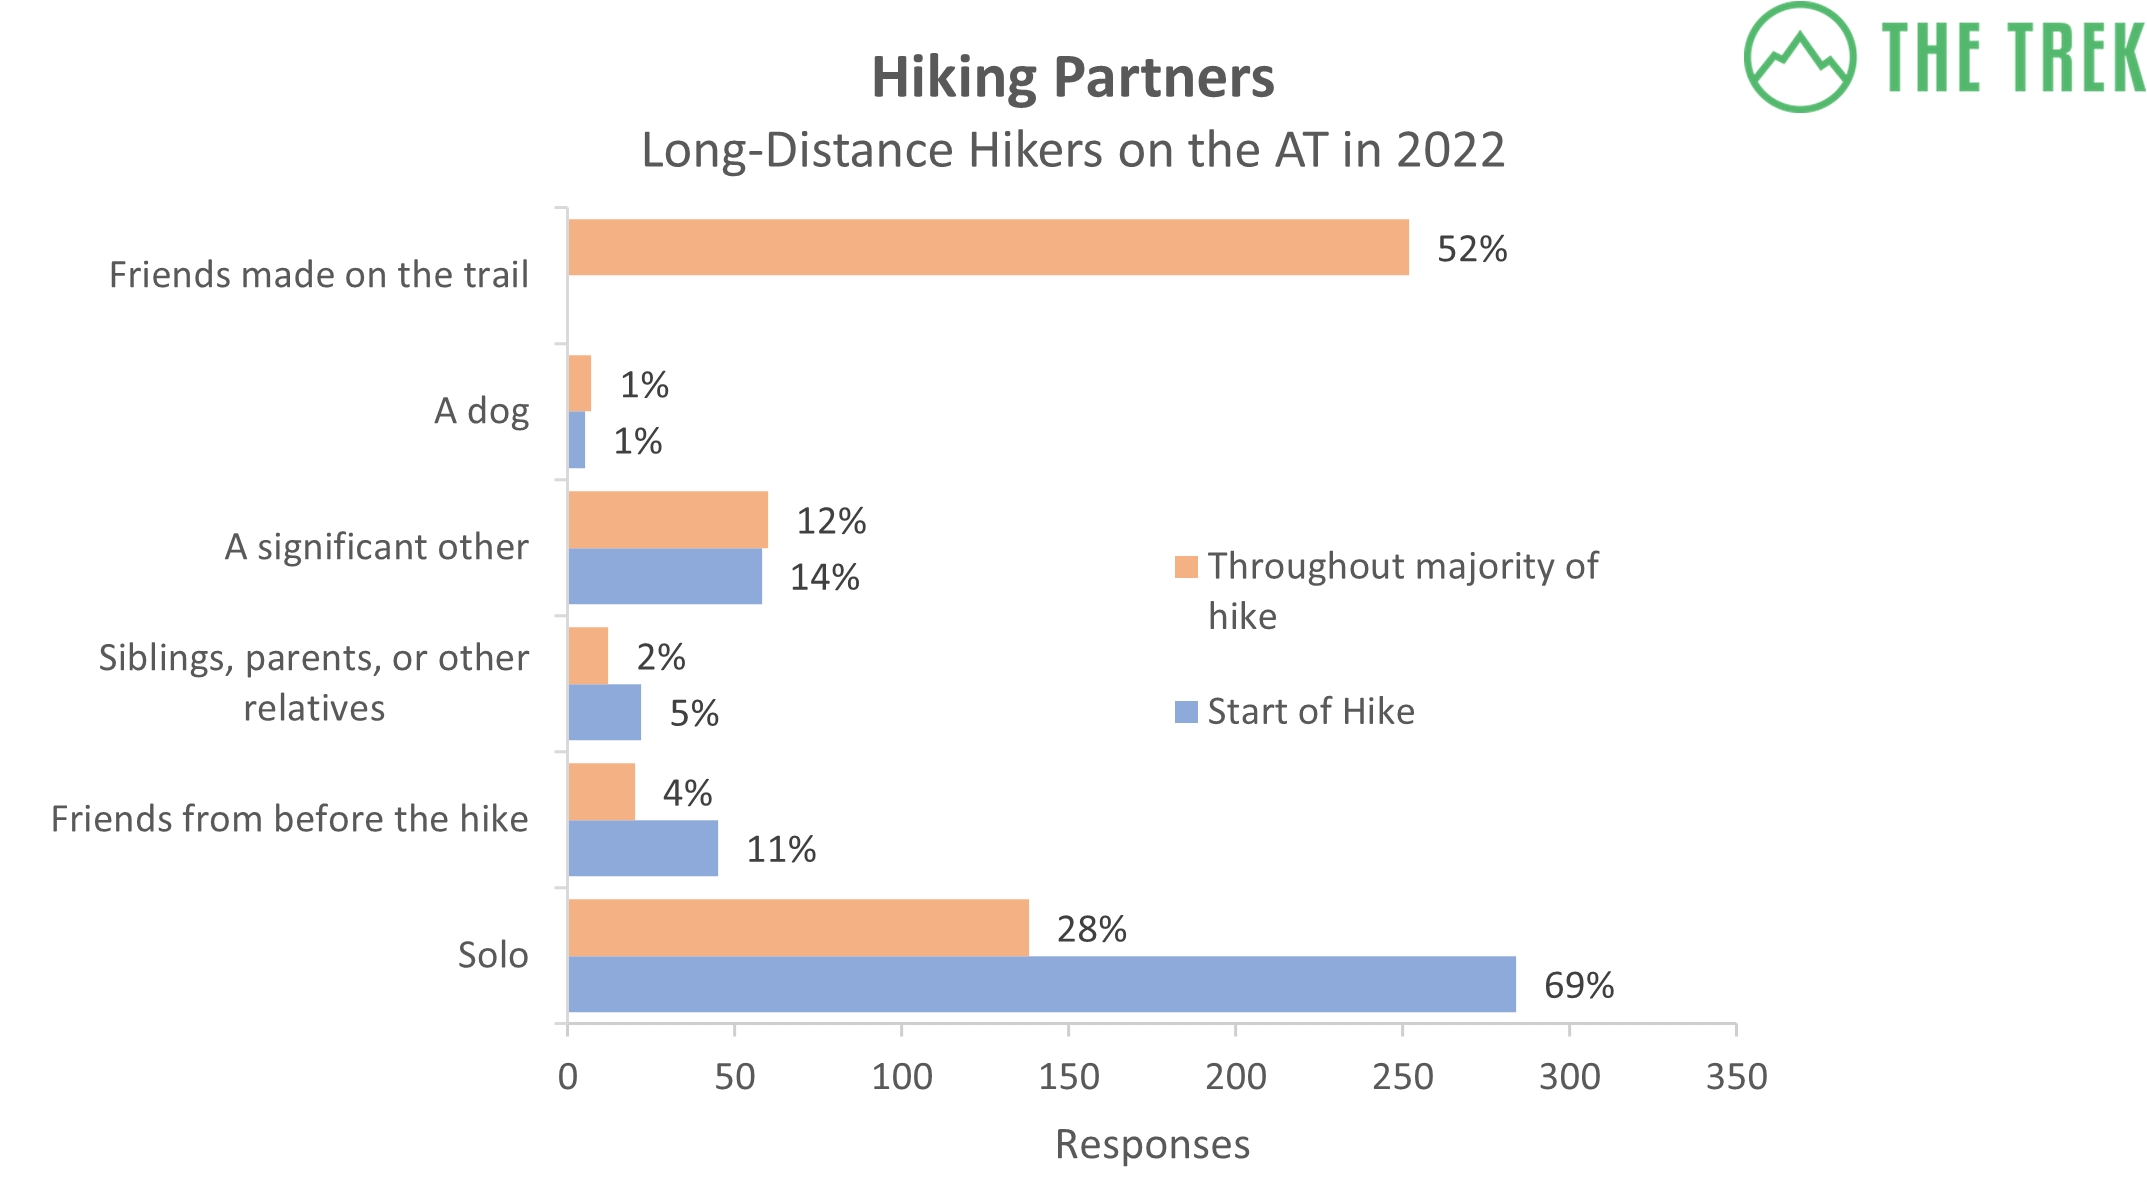
Over two-thirds of participants started their hikes solo, but most ended up spending the majority of their hikes with friends they met on trail. As opposed to past surveys, more hikers spent the majority of their hike with dogs than those that started with dogs. Five hikers started with dogs this year, while seven hikers spent the majority of their hike with a dog. However, one of the hikers starting with a dog did not finish with their furry companion.

Most participants rarely slept alone. Three-quarters of hikers claimed to have spent over 75 percent of the time with others nearby. On the other hand, 62 percent of hikers claimed to only sleep in shelters 25% of the time or less. Even though hikers seemed to prefer the social aspect of camping with others, most preferred their tents over staying in the shelters.
 Most hikers only struggled to find a space to camp 10 nights or fewer. Over 50 percent struggled to find a spot fewer than five nights. The number of overcrowded nights participants experienced has increased some from last year. This might be because the trail itself has gotten busier with fewer restrictions due to COVID.

The highest number of people participants saw at one campsite or shelter varied widely. The most common number of people was 30, while two hikers said they saw over 100 hikers at one campsite!

While most hikers camped with other people, the amount they hiked with others during the day varied wildly. Twenty-three percent of respondents hiked alone over 75 percent of time time, while 31 percent of respondents spent a quarter of the time or less hiking alone.
Littering Practices

A staggering 97 percent of participants packed out all of their own trash, and almost half of participants packed out trash that wasn’t theirs too.
READ NEXT –Common Leave No Trace Mistakes Made By Thru Hikers, and How To Avoid Them
Resources

We asked hikers which resources they used and whether they found them helpful or inspiring. FarOut (formerly Guthook) was the most helpful resource, followed by theTrek.co (thanks everyone!) and Youtube. “A Walk in the Woods,” both the movie and the book, were found to be the least helpful.
Many hikers mentioned that other current and former thru-hikers were the most helpful resources for them. A handful of participants also mentioned “Becoming Odyssa” by Jennifer Pharr Davis.
Here are links to the most popular resources:
- The FarOut App, formerly Guthook
- TheTrek.co
- The A.T. Guide – by David “AWOL” Miller
- The Appalachian Trail Conservancy website
- Appalachian Trials – Book by The Trek’s founder, Zach Davis/Badger
- Backpacker Radio Podcast series
- The Appalachian Trail Thru-Hiker’s Companion – Published by the Appalachian Trail Conservancy
Youtube: Some popular Youtubers that were mentioned included Dixie at Homemade Wanderlust and Darwin On the Trail.
Facebook: There are Facebook groups by class of thru-hikers (e.g., “Class of 2022”), a separate one for women, and one for the Appalachian Long Distance Hiking Association. These can be located with a simple search.
Instagram: It isn’t clear which pages hikers followed, but a good place to start is by following the AT hashtags.
Reddit: There are subreddits for the AT and for ultralight hiking, among others, that might be helpful.
Budget
We asked hikers about their budgets for their hike and the amount they spent on gear. It seems to get more expensive every year!
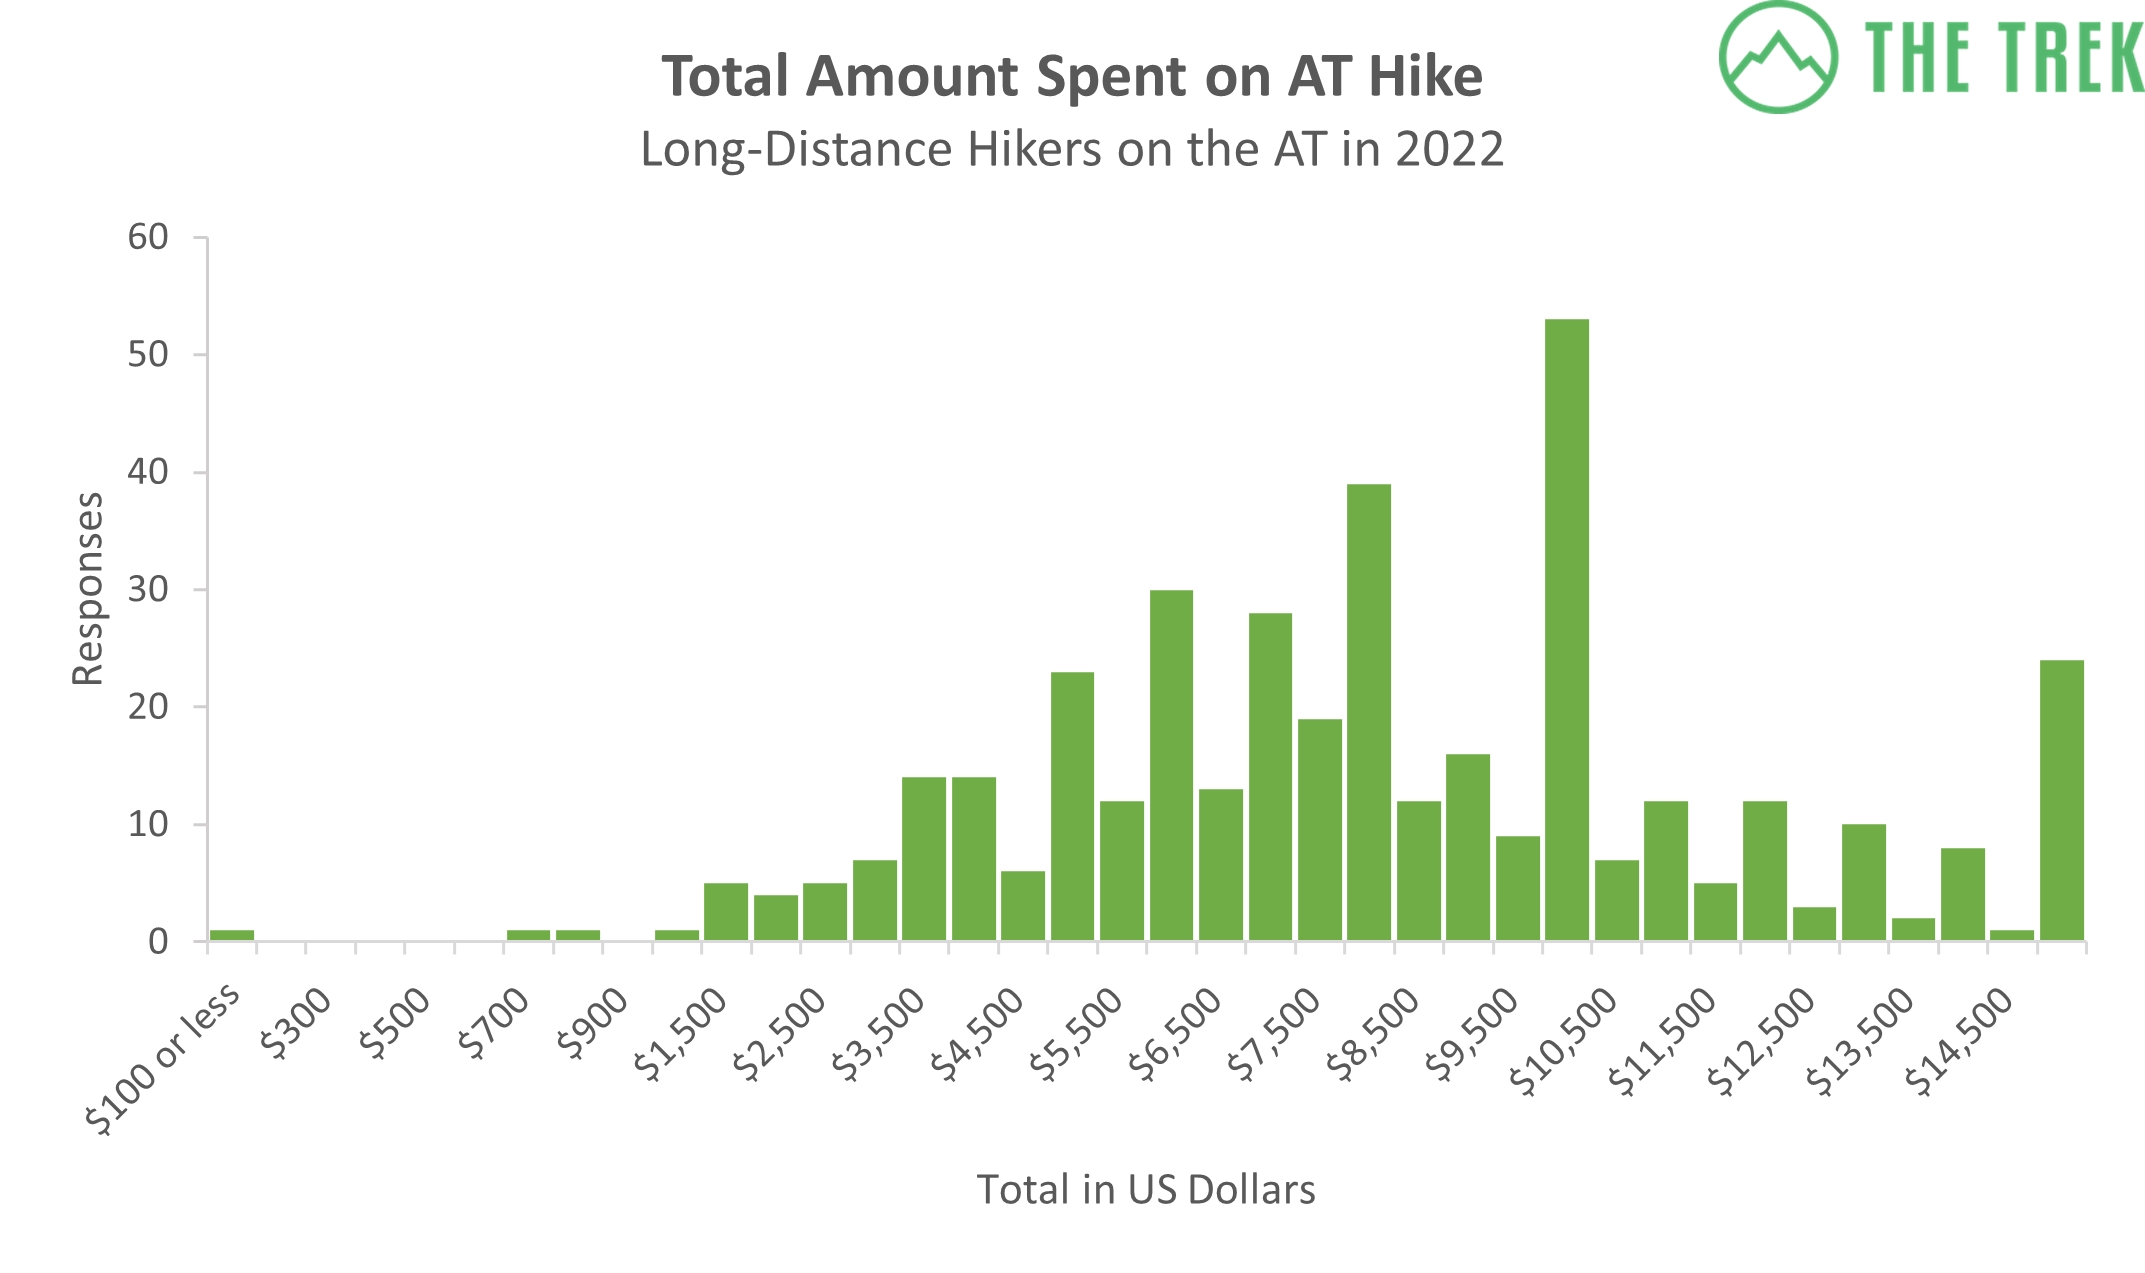
About one-third of hikers spent between $5,000-$8,000 on their hike. However, the most common amount spent was $10,000, and a whopping 24 people spent $15,000 or more! This brought the average and median up to $7,212 and $8,000, respectively.

Seventy-five percent of hikers spent between $1,000 and $3,000 on gear. Keep in mind that this includes the initial cost of purchasing gear for the hike, along with the ongoing costs of replacing or repairing shoes, clothing, and gear.
Favorites
We asked hikers about their favorite sections and hostels and which ones they liked the least. Here’s what they said.
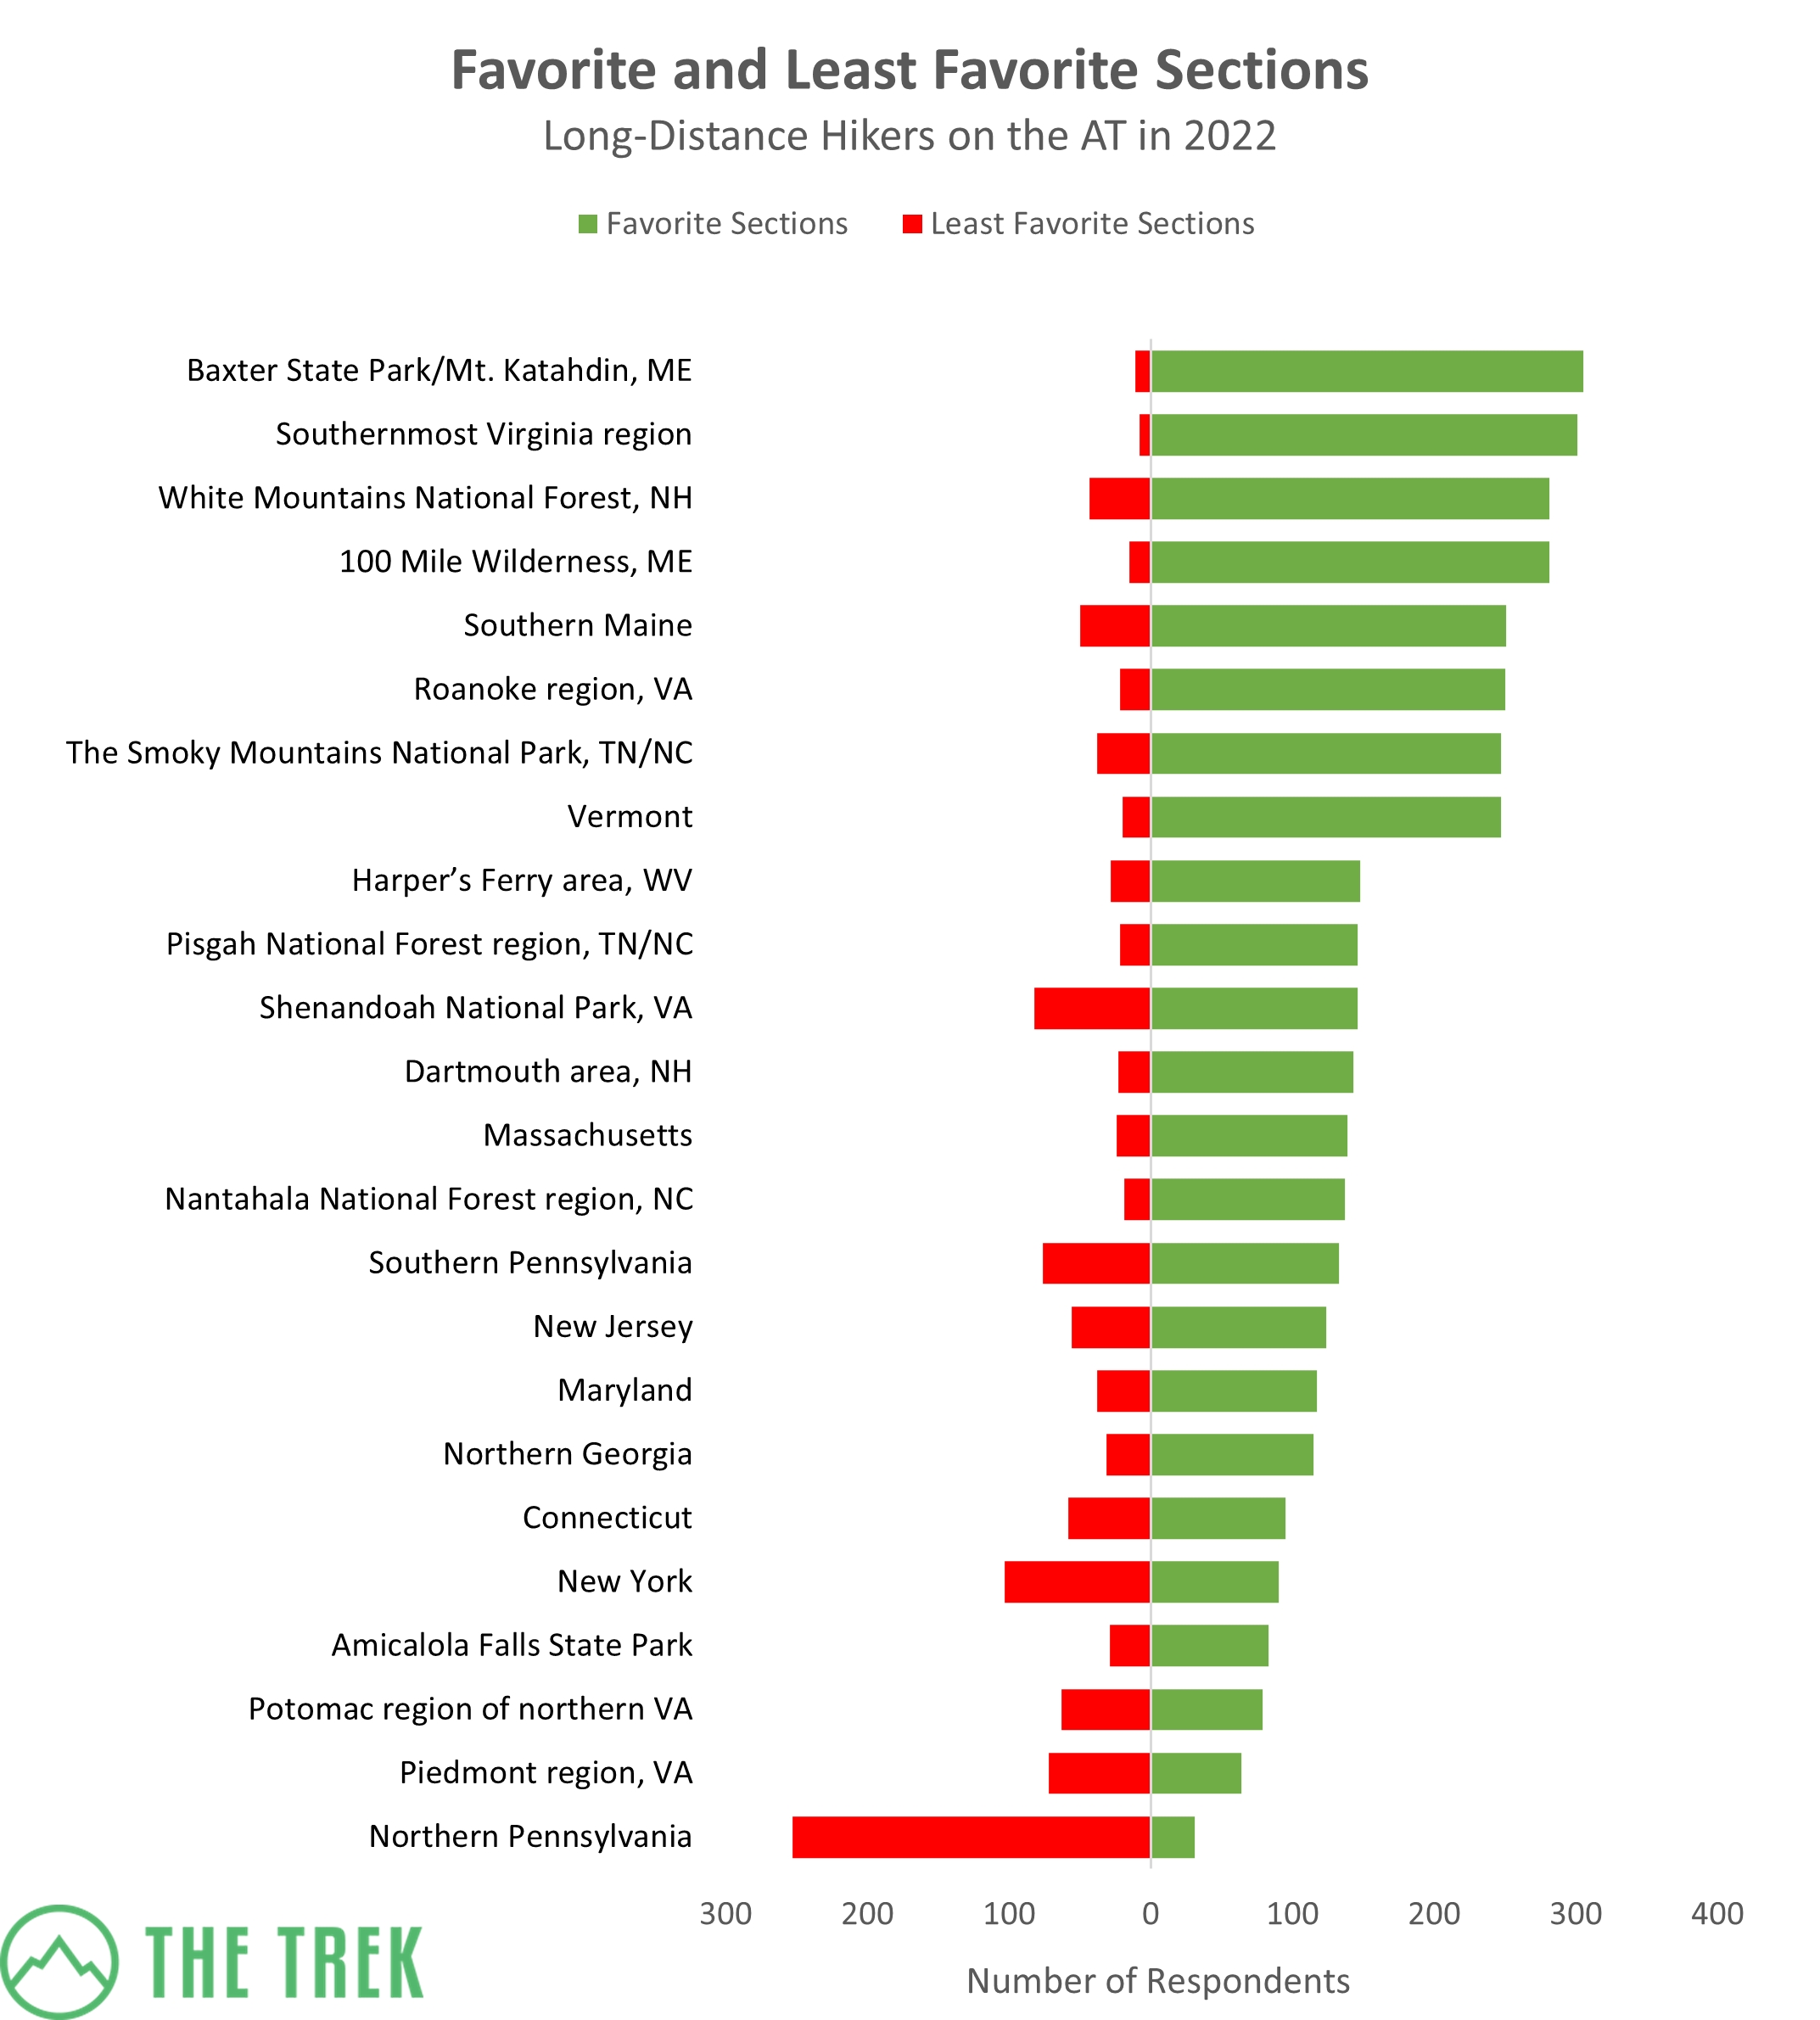
The most favored section was Baxter State Park/Katahdin in Maine. It beat out Southernmost Virginia this year, which came in second. The White Mountains in New Hampshire kept its spot in third. The least favorite section by far was Northern Pennsylvania.
READ NEXT – The Appalachian Trail State-by-State Overview: Highlights, Maps, Hiker Tips, and More

The most popular Hostel was Shaw’s Hiker Hostel in Monson, Maine, with over one-third of hikers naming it among their favorites. Second place goes to Maine Roadhouse, with Virginia’s Woods Hole Hostel coming in third. All hostels that were favored by at least 5 percent of hikers are included in the table above.
READ NEXT – A List of Hostels on the Appalachian Trail
Conclusion
This is the first in the series of posts for our 2022 Thru-Hiker survey. Upcoming posts will detail AT hikers’ favorite backpacks, footwear, shelter systems, sleeping bags, and stoves/filters. Please leave any feedback, questions, or comments in the comment section below; we’d love to hear your thoughts!
To stay up to date on the latest survey posts, make sure to subscribe to our newsletter.
Congratulations to all the Appalachian Trail hikers this year — and a huge thank you to all of you who took the time to fill out the survey!
Featured image: Graphic design by Chris Helm.
This website contains affiliate links, which means The Trek may receive a percentage of any product or service you purchase using the links in the articles or advertisements. The buyer pays the same price as they would otherwise, and your purchase helps to support The Trek's ongoing goal to serve you quality backpacking advice and information. Thanks for your support!
To learn more, please visit the About This Site page.

Comments 25
Perhaps next year you could ask if any hikers are veterans. Much like college graduates, veterans often find themselves in a time of transition that provides an opportunity to do a thru hike.
Met some fantastic vets on my 2000 NOBO thruhike.
RIP Crash.
Thx for the post.
What about Marijuana use? Love to know that.
Your section titled “Check-Ins With the ATC” says “50%” checked in with the ATC at Katahdin.
There is no ATC presence at Baxter State Park. The closest ATC presence is 110 miles away in Monson.
Speaking for my late wife, Shirl “Bama” Funderburk, Class of 2006, I am disappointed that more people didn’t use TrailJournals.com as a guide to plan – and experience – their hike. Although Bama read many books, especially by women, she really benefited from the daily journals. Yeah, they can be a little raw and not always well-written, most are an honest day-to-day accounting of the trail and local amenities, especially knowledge of supplies, rides to town, and other helpful info. Respect for Leif for keeping it up and running for all these years.
Great article except take the wokeness out of it. Hiking is not about that.
When will you release article on the 2022 AT backpacks?
Agree with Roger, marijuana use seems increasingly prevalent. Remove the Puritan cap and get some numbers. Slackpacking is similarly on the rise, you should poll for that, too.
Thanks for the data.
On YouTube, I also liked Wild on the Trail. He showed several sections of the trail during his thru hike.
I was the ridgerunner in Northern PA for two seasons, 2019 and 2021. For work, I did this section over 30 times between the two years. It jumped out at me that this was the least enjoyed section of the Trail!
When I spoke with northbound hikers, many spoke of “hating” Northern PA and passed on this wisdom to southbound hikers coming our way. These folks for the most part really enjoyed Northern PA, which I found to be a refreshing contrast.
I wonder how all of this information would change if you sorted by NOBO, SOBO, Flip-Flop, and whatever else people have started doing.
WikiTrails is a really useful planning webapp. It generates itineraries based on basic input. I depended on it in 22.