 ">
">
The 2019 Hiker Survey: General Information
This is the first post of 2019 in The Trek’s annual survey of Appalachian Trail thru-hikers and long-distance section hikers. This year, we gathered new information on hikers’ favorite hostels along the AT. Changes from last year also include several new favorite resources among hikers.
Participants were recruited through social media, particularly Facebook groups for 2019 AT thru-hikers. Data were collected from September 2019 to November 2019.
Demographics

365 people who hiked on the Appalachian Trail in 2019 took the survey. The average (mean) age of hikers in the survey was 36 years old, plus or minus 15 years, with a median age of 30 years old. Hikers ranged in age from 13 to 70 years old.
59.4 percent of hikers were biologically male and 40.6 percent were female. Regarding gender identity, 59.0 percent of hikers identified as men, 39.9 percent as women, and 1.1 percent identified as non-binary.

The vast majority (95%, n = 286), of hikers in the survey were white non-Hispanic. Seven hikers identified as Hispanic/Latino/Latina, five hikers as Asian, three as multiracial, three as Native American/Alaska native/Hawaii native, and none as black.

Nearly three-quarters of hikers in the survey (72.6%) had bachelor’s degrees. One of the four hikers who had not yet finished high school was only 19 years old. Keep in mind that 21 hikers in the survey were age 21 or younger, seven hikers were age 18 or younger, and one hiker was 13 years old.
Nearly all the hikers were from the US. (89.5%). A total of 38 hikers came from countries other than the United States. Six hikers each, or 1.7 percent of hikers, came from Australia and Canada. One or two hikers each were from Denmark, El Salvador, England, France, Germany, Hungary, Ireland, Mexico, The Netherlands, New Zealand, Northern Ireland, Poland, Scotland, Sweden, Switzerland, or Taiwan.

Unsurprisingly, the states with the highest numbers of AT hikers were states the Appalachian Trail passes through. Other than the 14 AT states, the most hikers were from Florida, Texas, Ohio, and Wisconsin, in that order.
Hiking Basics

The majority of hikers had gone backpacking between one and seven nights. Very few had no camping or hiking experience, just as very few had done long-distance backpacking. Of the ten hikers with no prior camping or hiking experience, six (60% of them) completed a thru-hike and the other four made it less than 1,000 miles. Of the 60 hikers who had only day-hiked or done car camping, 50 (83% of them) completed a thru-hike.

Thru-hikers were the target of this survey, and comprised the majority of hikers who took it.

Of the 72 survey participants who did not thru-hike, 23 had intended a section hike. The other 48 who were unable to finish intended thru-hikes. Injuries were the most common reason that hikers quit. This annual survey doesn’t go into detail about reasons hikers quit, but check out our data on the separate trail casualties survey we did in 2017 for more information on illness, injuries, and reasons hikers quit. However, this year, the emotional reasons for leaving the trail were different from the typical stressors of a thru-hike. At least one hiker left the trail because of stress and grief surrounding the murder of Ron Sanchez/Stronghold.
Timeline
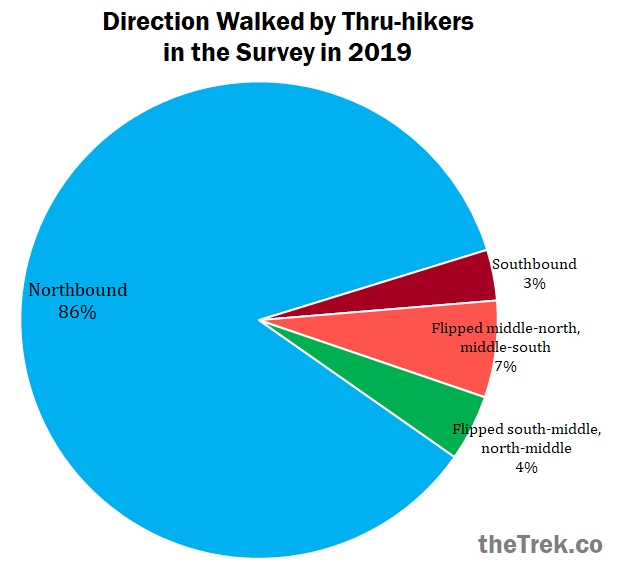
The vast majority of thru-hikers who took the survey walked northbound, which is by far the most common direction for AT thru-hikes. About 14 percent of survey respondents hiked southbound or flip-flopped, although this year we are leaving the survey open for these hikers a few months longer so we can do some southbound-specific posts later in the year.

The majority of hikers started their hikes between early March and early April (with March 27 being the most popular date), which is considered the bubble for AT thru-hikes. The earliest hikers began in January 2019. The latest start date for a thru-hike was August 11, 2019, by two southbounders. While there are far fewer southbound and flip-flop attempts each year compared to northbound attempts, mid-June appears to be the most popular start time for southbound thru-hikes.

The most common finish dates for northbound thru-hikers were throughout the month of September, and early October. Several hikers were still in progress when they took the survey.
Pace
For thru-hikers, the average and median pace they walked was 15 miles per day, with two thirds of thru-hikers maintaining an average pace between 12 and 18 miles per day. The slowest pace reported by a thru-hiker was 5 miles per day while the fastest was 30.7 miles per day.
In contrast, the pace was several miles per day slower for section hikers and people who attempted, but did not complete, thru-hikes. The average pace for section hikes and incomplete thru-hikes was 12 miles per day (median 12 miles), with two thirds of ranging from 8 to 16 miles per day.
Partners

The majority of thru-hikers who took the survey set out alone, but most ended up hiking the majority of their trek with friends made on the trail. Unfortunately, each year, the drop-out rate for dogs seems to be about 50 percent, meaning about 50 percent of the dogs whose humans complete a thru-hike do not make it through the majority of the hike.
Littering Practices
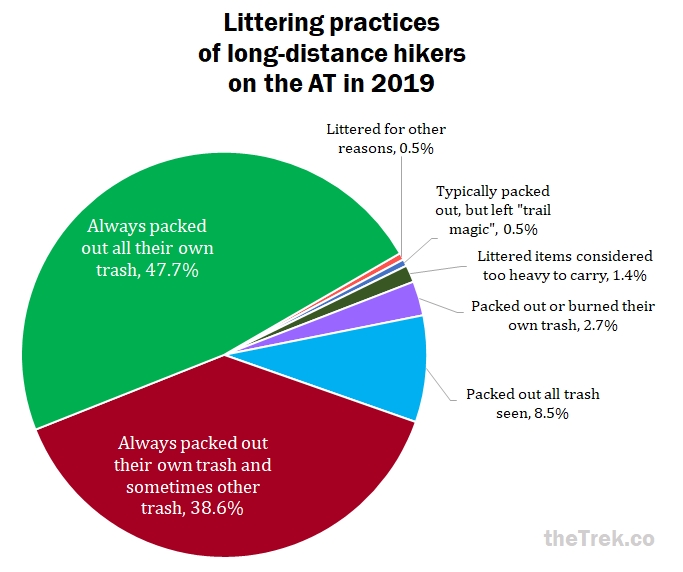
About 95 percent of hikers reported they typically packed out all of their own trash. Almost half of these hikers sometimes packed out other litter on the trail. Seven percent of hikers in the survey packed out all the litter they encountered!
Related reading: Leave No Trace on the Appalachian Trail
Budget
We asked hikers in the survey how much they spent on gear for their hike, then how much they spent total (gear and expenses along the way). Last year, the maximum response option I included for budget was “$6,000 or more,” which was clearly too low since 40 percent of hikers spent $6,000 or more in 2018. So this year, I increased the multiple choice response options to try to get better information about how much hikers spent.
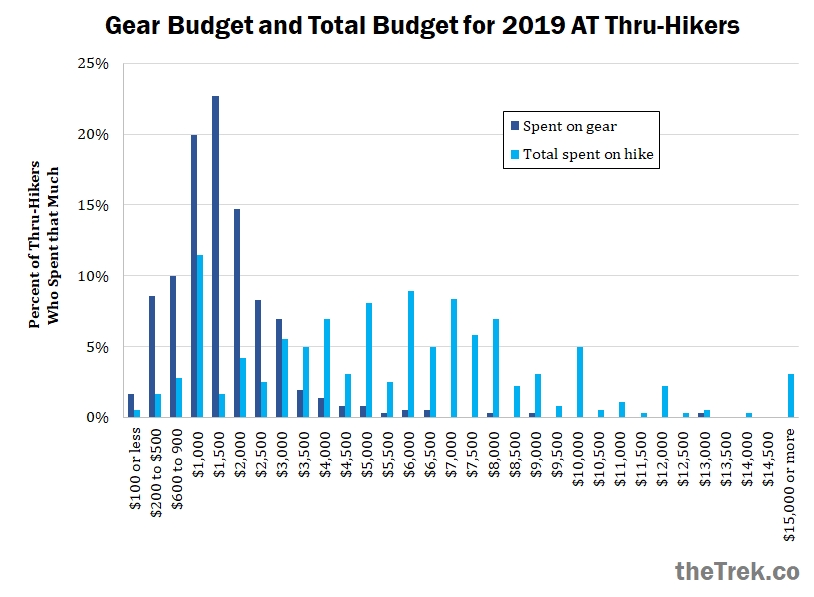
For their total budget including gear, any amount between $1,000 to $8,000 was pretty equally common, with 85% of hikers spending $1,000-$8,000. The median amount hikers spent was between $5,500-$6,000. So, if you are trying to plan a budget for an AT thru-hike, I would suggest you aim to budget about this amount.
An important factor in your overall budget is how much you spend on gear. The median amount hikers spent on gear alone was between $1,000 and $1,500. Nearly all hikers in our survey (85.9%) spent between $200 and $3,000 on gear. It is important to budget for gear replacements, especially footwear, but most gear costs will be easier to plan than day-to-day expenses, since you should be buying your gear before you set out.
Is anyone else as surprised as me that 11 hikers, or 3.1 percent of the sample, spent over $15,000 on their overall budget? I checked their responses to other questions for unusually expensive features of their hikes, such as yo-yo’ing or injuries (none of them reported either of these). Only one hiker with a $15,000 budget reported it was not sufficient, since nearly all their gear broke or malfunctioned and needed replacing. A second hiker who spent $15,000 actually left the trail after 900 miles due to the “Emotional toll of friend being murdered on trail (Ron Sanchez/Stronghold).” It’s possible this hiker had to deal with unusual and unfortunate expenses pertaining to that murder or the other crimes committed by James Jordan on the AT this past year. So, if you have any input about reasons some hikers spend so much, feel free to comment below, but please be respectful because some of these hikers may have had tragic circumstances affecting the costs of their hikes.
Resources
We asked hikers which resources they found helpful or inspiring and which ones were not. We also asked them what other resources they used that we hadn’t mentioned.

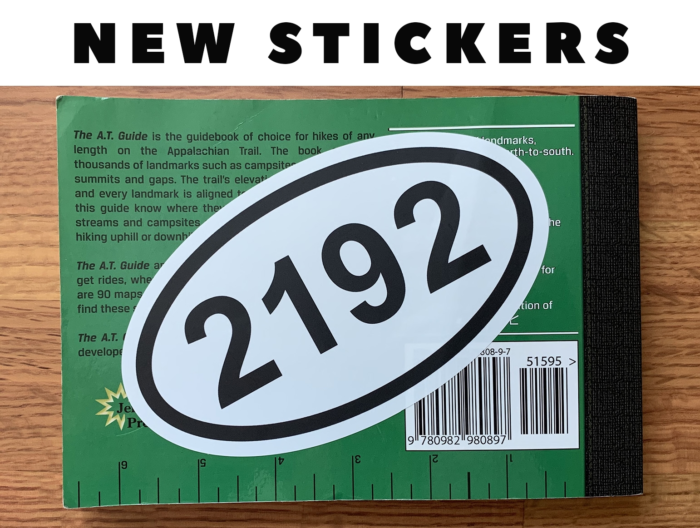
The two most popular resources by far were The A.T. Guide by David “AWOL” Miller and the mobile app Guthook by Atlas Guides. Anecdotally, the AWOL guidebook has been the most popular resource for AT long-distance hikers for many years, and it ranked Most Helpful or Inspiring in our previous surveys. Last year, the Guthook app and the AWOL guidebook were neck-in-neck in the lead as the most valuable resources for AT hikers, with Guthook less than a percentage point ahead of the AWOL guidebook. This year, Guthook clearly overtook the AWOL guidebook as the most popular resource. 83.2 percent of hikers rated Guthook as helpful or inspiring, while 75.9 percent of hikers gave that rating to the AWOL guidebook.
Several other resources saw an increase in popularity from last year. The ATC website jumped in popularity from 52 percent last year to now 61 percent of hikers rating it helpful or inspiring. Similarly, podcast popularity increased from 29.2 percent to 38.5 percent. One popular AT-related podcast is Backpacker Radio, which 29.1 percent of hikers rated as helpful or inspiring.
Here are links to resources (where possible), in order of their popularity:
- The Guthook app
- The A.T. Guide by David “AWOL” Miller
- TheTrek.co
- The Appalachian Trail Conservancy website
- Appalachian Trials – Book by The Trek’s founder, Zach Davis/Badger
- A Walk in the Woods – Book by Bill Bryson
- Backpacker Radio Podcast series
- WhiteBlaze.net
- The Appalachian Trail Thru-Hiker’s Companion – published by the Appalachian Trail Conservancy
- TrailJournals.com
Facebook: There are Facebook groups by class of thru-hikers (e.g., “Class of 2019”), a separate one for women, and one for the Appalachian Long Distance Hiking Association. These can be located with a simple search.
Instagram: It isn’t clear which pages hikers followed but if you’re interested in following hikers on Instagram, check out our post about some of the top Instagram pages for AT hikers.
Reddit: There are subreddits for the AT and for ultralight hiking, among others that might be helpful.
YouTube: The YouTube channel most often mentioned by hikers was Homemade Wanderlust by Dixie/Jessica Mills.
The only resource more often disliked than liked was A Walk in the Woods (the movie), which has been more disliked than liked each year we’ve done this survey.
Hostels
This was the first year that our survey included favorite hostels! By hostel, we mean any place indoors, near the AT, where hikers can stay, that is not strictly a hotel. So this included a few homes that informally take in hikers, publicly run facilities, and some local/historic hotels that have hostel-style bunkrooms. (We did not include the huts in the White Mountains.) We accounted for 121 hostels in our list this year, and asked hikers to select up to three favorite hostels out of the list.

Shaw’s Hiker Hostel in Monson, Maine, was the most popular, ranked as a favorite by almost half the hikers in our survey. The Human-Nature Hostel in Roxbury, Maine, ranked second, followed closely by Woods Hole Hostel and B&B in Pearisburg, Virginia. The Station at 19E at Roan Mountain, Tennessee, was the fourth ranked. In the table above, I included all hostels that were a favorite of 5 percent or more of the hikers.

Festivals and Check-Ins

Over a third of hikers in our survey attended Trail Days in Damascus, Virginia, but very few attended the kickoffs at Harpers Ferry or Springer Mountain. Most did not attend any of these festivals at all.
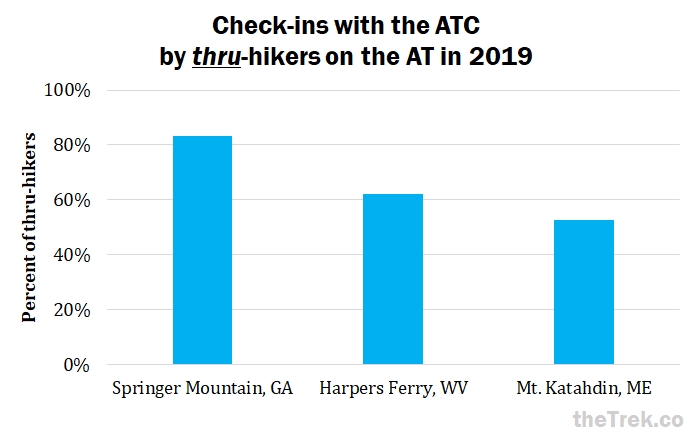
Regarding thru-hikers only, about four out of five checked in at Springer Mountain, three out of five checked in at Harpers Ferry, and about half checked in at Mount Katahdin. This means about ten percent fewer hikers checked in at Harpers Ferry and Katahdin, compared to last year. Checking in with the ATC helps them research surges in numbers of hikers and to prepare for future maintenance of the trail.
More From the 2019 Hiker Survey
This is the first post on our survey of the hikers of 2019. Upcoming posts will cover our survey data on backpacks, footwear, shelter systems, sleeping bags, stoves, food, and water, and sleeping pads. Subscribe to The Trek’s weekly newsletter to ensure you don’t miss future installments.
CONGRATULATIONS and many thanks to all the hikers who took the survey! Best of luck to those who are still on the trail. Thanks also to Zach Davis and Maggie Slepian for coordinating and for spreading the word about the survey, and especially for putting together that long list of hostels for me to use.
Featured image via Koty Sap

This website contains affiliate links, which means The Trek may receive a percentage of any product or service you purchase using the links in the articles or advertisements. The buyer pays the same price as they would otherwise, and your purchase helps to support The Trek's ongoing goal to serve you quality backpacking advice and information. Thanks for your support!
To learn more, please visit the About This Site page.

Comments 30
thank you it’s very interesting and useful! Pickleball AT2020
Love, love, love the stat’s! I am a trail angel/Trek writer and often get asked questions related to topics on your survey from hikers I serve while out on the trail and your well put together report is the most complete resource I’ve found on the subject. Your stat’s keep getting better each year. I look forward to what 2020 holds! Yours truly—Bloodhound
So glad you are still doing these.
I am curious about the correlation, if any, between prior experience and completion.
Thanks for the great info! Someone did a lot of work, though fun work! I’ve been wondering if there’s stat on the age of finishers of a thru-hike. I know there are a good number of “older” folks, like myself, that start, but all the photos I see finishing appear to be in their 20’s and 30’s. Is there information on that?
Very interesting! Thank you for doing this again.
I’m most interested in some drilled down info like what % of women completed their hike and the racial breakdown between men and women and age.
The Facebook group mentioned in the part of resources is https://www.facebook.com/groups/ATWomen
??
Having those of you put out this kind of quality content gives me so much confidence in my 2020 AT attempt. Y’all are awesome.
Love the facts and figures. For those of us taking a mid-career break for a thru-hike (as opposed to those hiking straight out of college or after retirement), I wonder how much it costs in total when taking 6 months of lost wages, ongoing bills and mortgage payments into account – far more than the average figure quoted above, I suspect. But that’s the true cost to the mid-career breakers among us – myself included when I come over from London next year for the AT thru. Beaucoup bucks, but got to do it anyway.
Really enjoyed the analysis. Another aspect I would be interested in would be families. How many of these hikers are married? Children?
Would also like to know their careers. Teachers? Business owners? I.T.?
I know we could ask endless questions of these vagabonds. Hike on. ???
Hey there
Did you do a training week at Outback in Utah?!
It’s great to be here with everyone, I have a lot of knowledge from what you share, to say thanks, the information and knowledge here helps me a lot. atari breakout
trail festivals
would be nice to have the dates they were
would give relevance to why some [most ] did not go
and possible aims for those some to aim for
a great read , thanks
This is great – thanks! It would be helpful if you included the number of days it took respondents to complete their thru hike.
I’d be interested in seeing a breakdown of finishers by age. For example, what age group is most likely to complete the hike? Do senior hikers fail to complete the hike at a higher rate than younger hikers or vice versa? What age range is most favorable to completion? Does one particular age group seem to fall short on a regular basis?
Thanks for the great info.
Hi guys if you like to watch online funny video then click here whatsapp status video download just visit and play video if want download click on download button
Very nice article check out my new article https://whatsappstatustube.com/maha-shivratri-status-videos-download/
Hear is all types of hard work quotes are there visit Quotes Quietly for more quotes on hard work. Top 51 cute good night quotes | inspirational good night quotes.
I love this! I’m doing research for a course I’m taking and I’m so glad I came across this – I love the choice of information gathered like the littering practices and partners. I also found it interesting the education background and how the most common distances were either the highest or lowest end.
But I have a question – under partners, you stated that typically, 50% of dogs don’t complete the hike. That was pretty vague – Do they die? Get injured? Run away? Do their humans drop them off somewhere?
If you’re even still responding to this post, I’d love to know more about that!
Include how many are military veterans when you look at education demographics.